
Devices
A device is anything the server talks to over the network: consoles, processors, video routers, sensors, or another sndwrks product.
Devices are the building blocks for everything else: routing, macros, and haze watch all reference them.
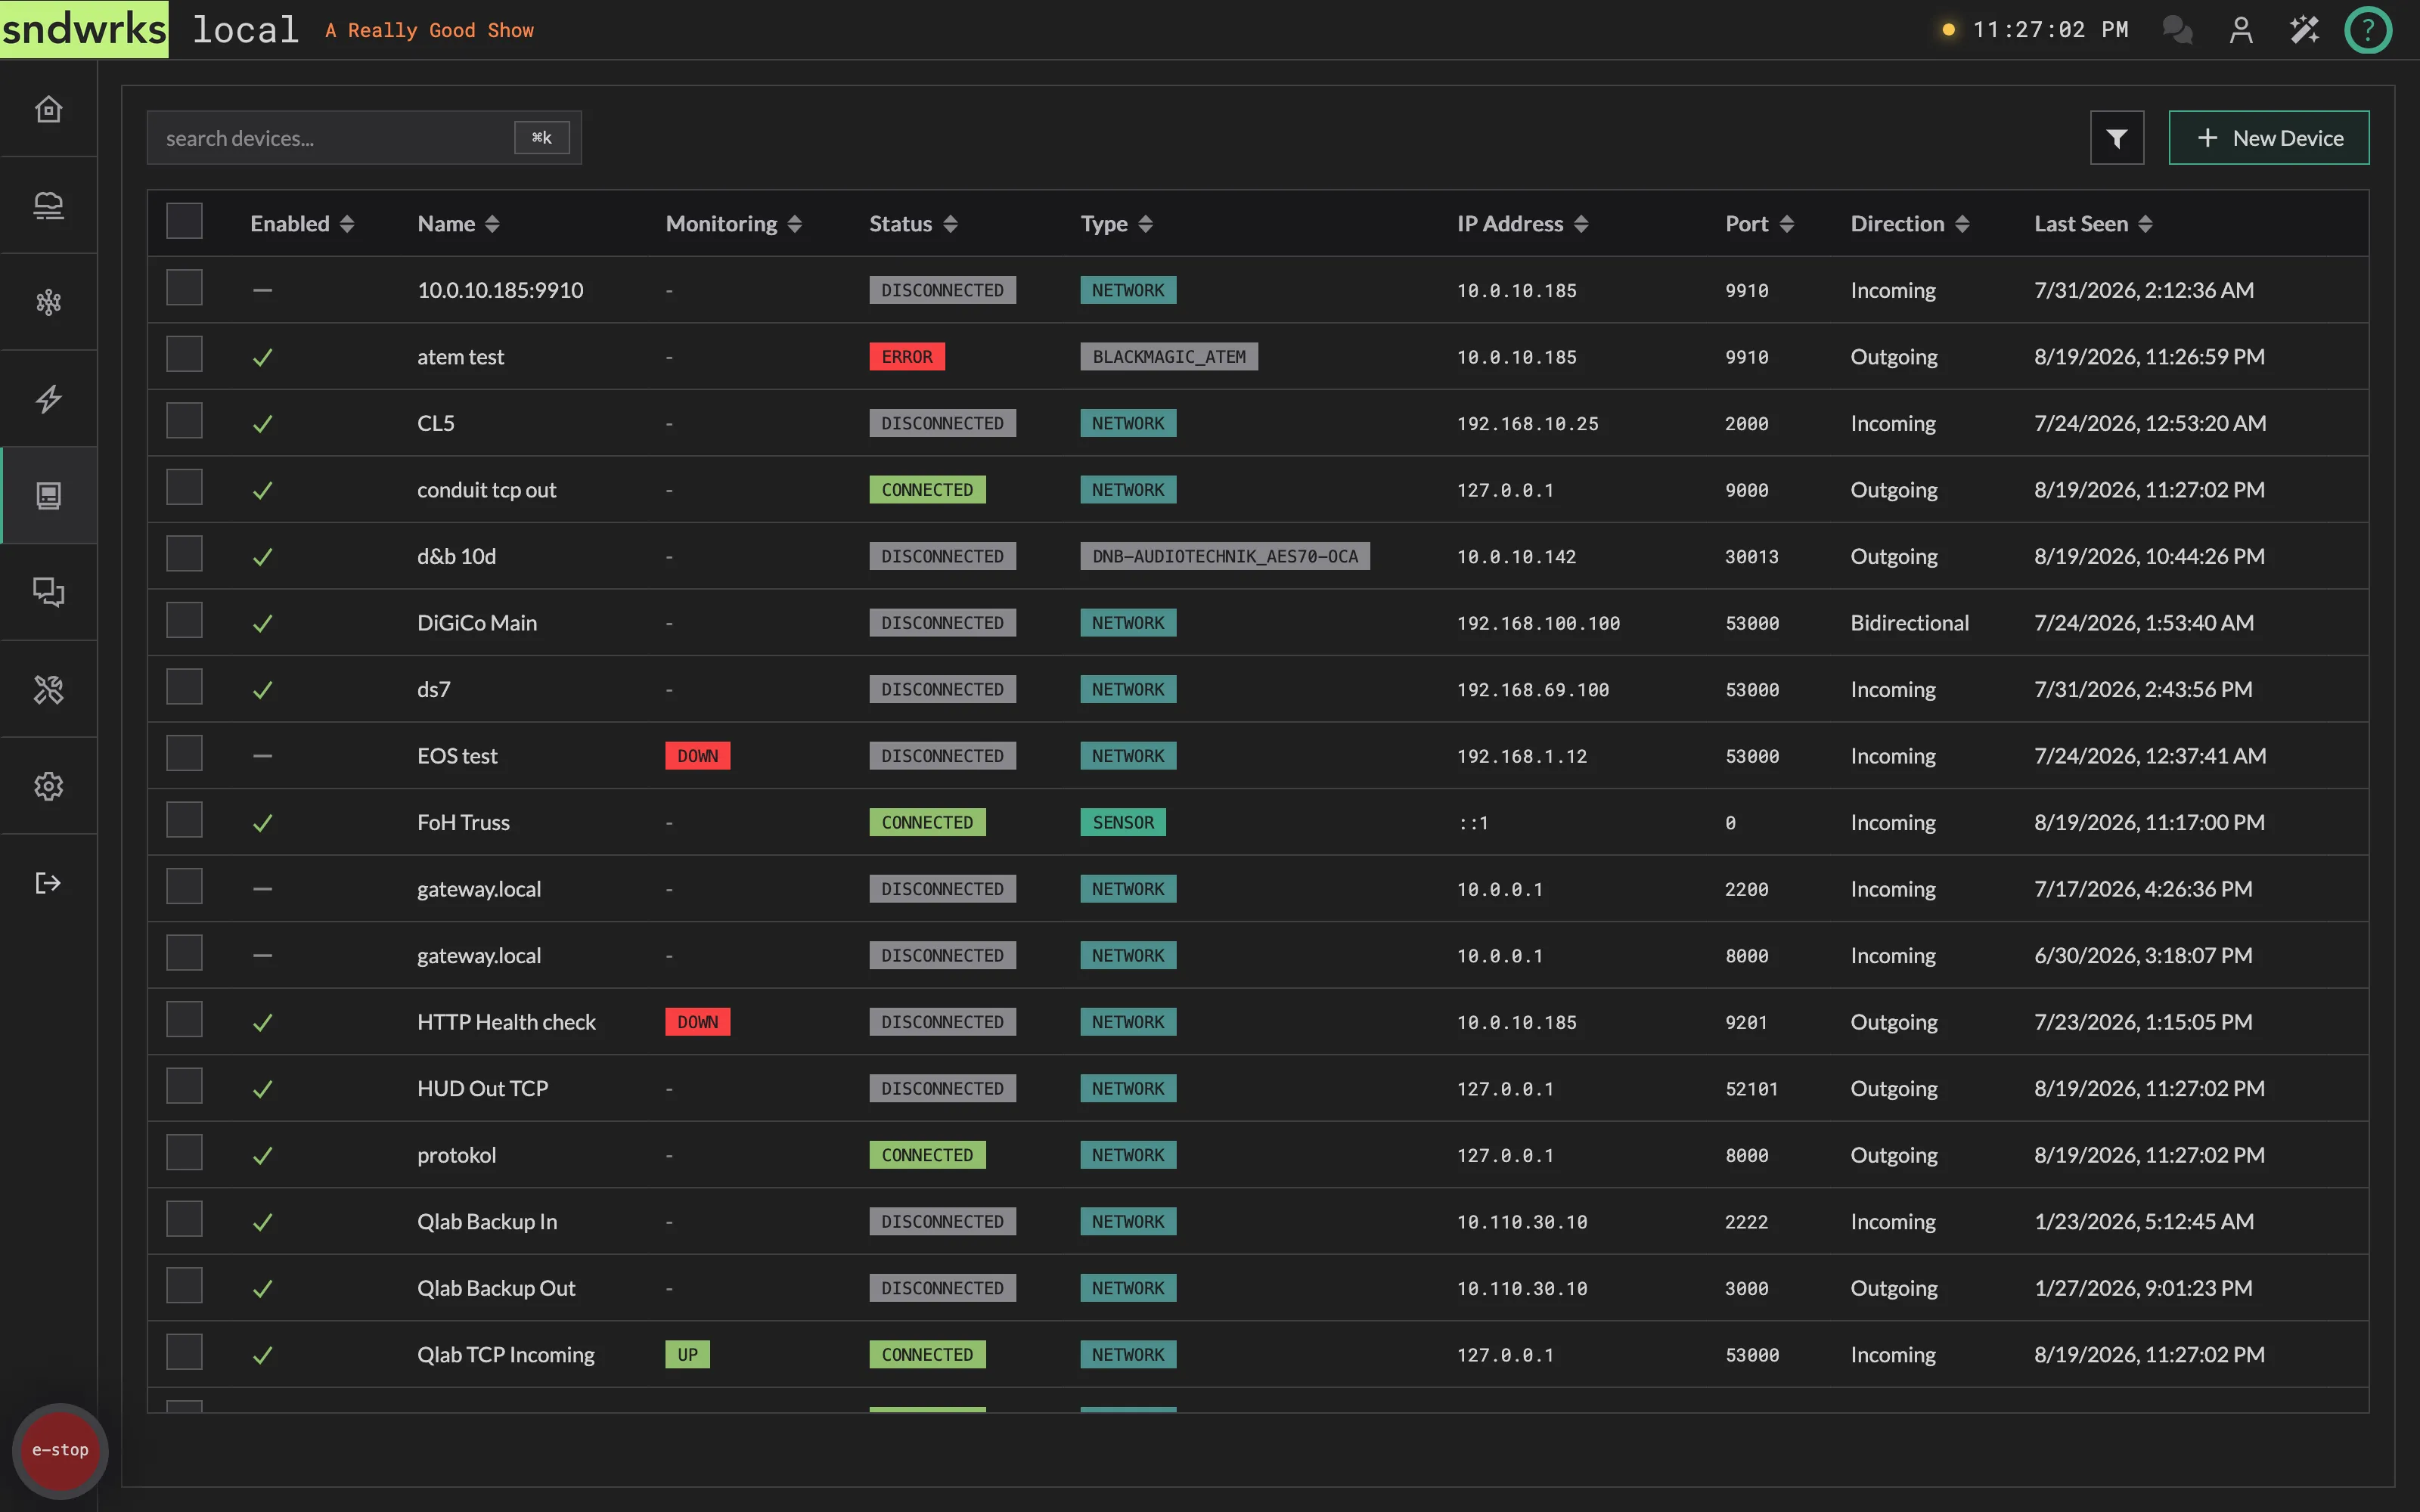
We are consistently adding new device types, if there’s something you want to control tell us!
Add a device
Section titled “Add a device”There’s three ways to add devices: manually, via network scan, or by sending a message to the server. We will show the manual process here.
sndwrks sensors are the exception — they add themselves and you approve them. See Device Adoption.
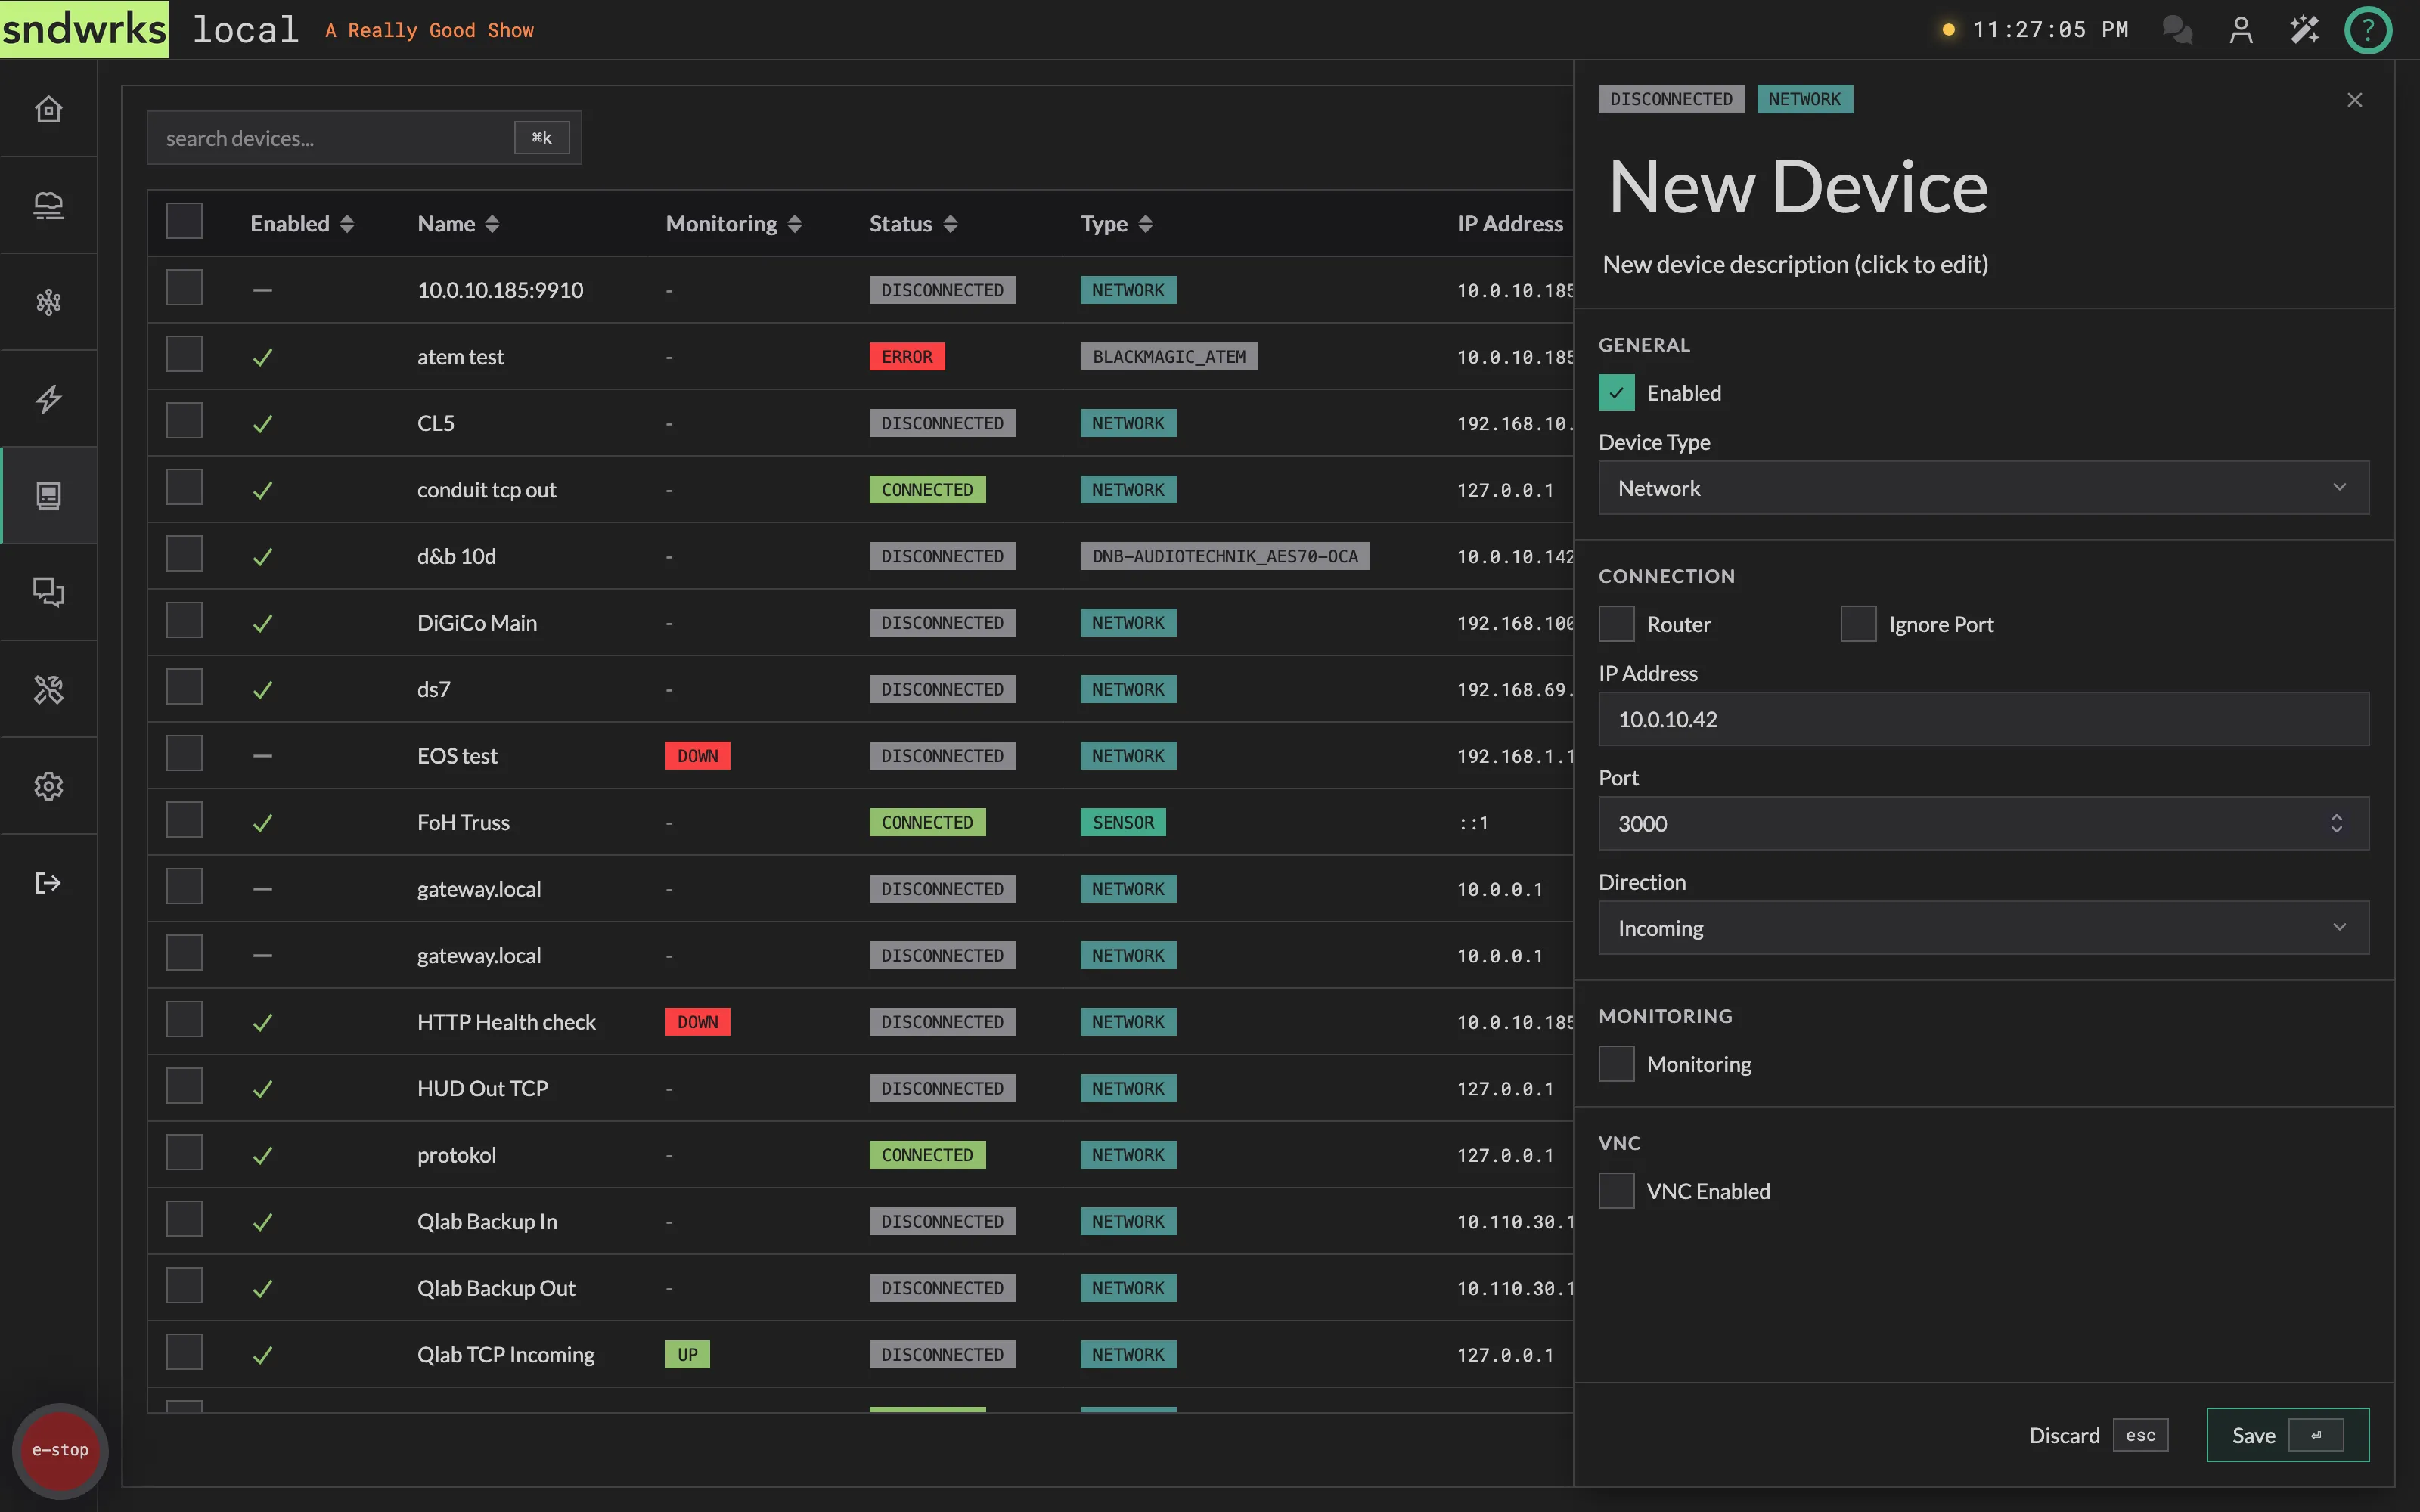
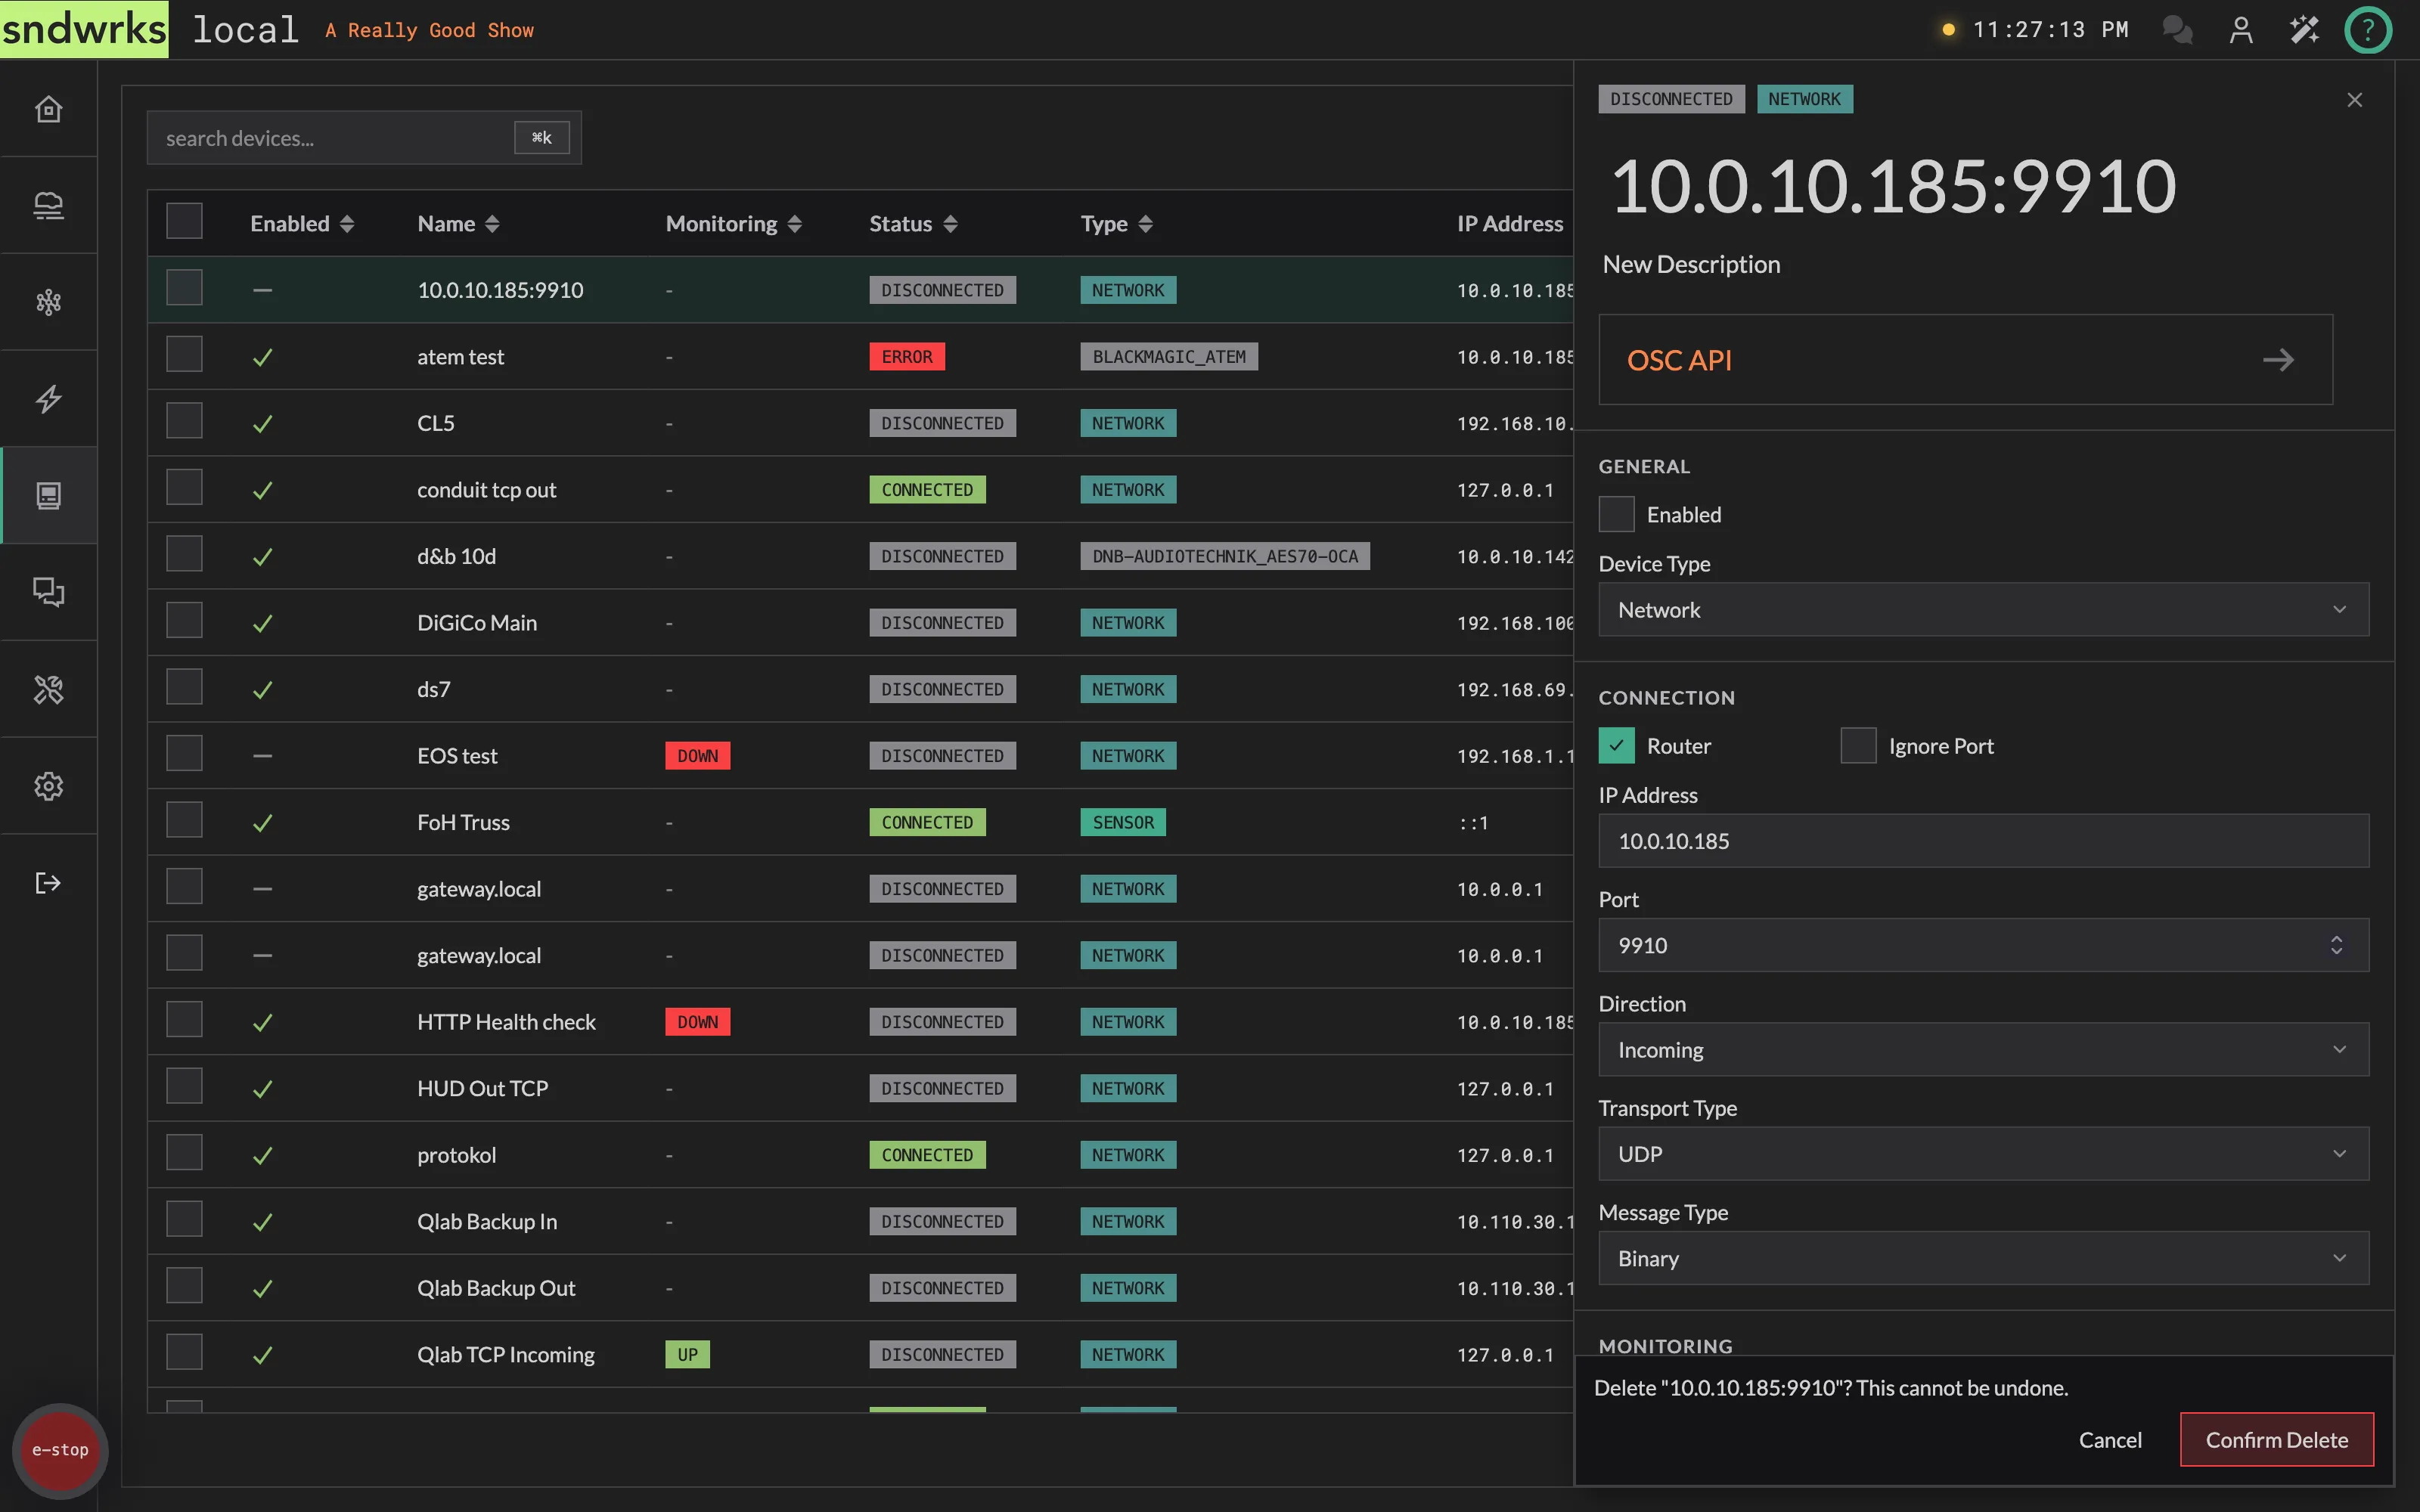
- Open Devices and click New. An inline editor opens on the right.
- Click the heading to rename, click the description to edit. We find it’s helpful to add In or Out to the name to indicate the direction of the device.
- Pick a Device Type.
NetworkandSensorare the generic types; the rest are specific device integrations (e.g.dnb-audiotechnik_aes70-oca,lacoustics_la4x,blackmagic_videohub,adderlink_x-dip). - Set IP Address and Port or other depending on the integrations. For example, the d&b port is automatically set.
- Set Direction (incoming, outgoing, or both — depending on the integration).
- Check Router if you want this device to appear as a row or column in the routing matrix.
- Check Enabled if you want the device to start working immediately.
- Optionally select Transport Type/Message Type if you checked Router.
- Press
⏎to save, orescto discard, or click the buttons there.
New Device Page
Options
Section titled “Options”There are various options to define how you’d like your device to behave.
If a device was added by sending a message to the server, these bits will be automatically filled out based on what the server was able to detect.
Enabled
Section titled “Enabled”This turns the device on. This can be controlled via the OSC API.
If a device is disabled, only OSC API commands from this device will work, every other function associated with the device (router, macros, etc) will not function.
Ignore port
Section titled “Ignore port”Ignore port allows for incoming connections that send on multiple ports (like QLab). Enabling this option will only check the IP address for a connection type and transport.
So, if you’re sending QLab on TCP, you’d enable this, but you could send in on UDP from that same IP and that would be a different device.
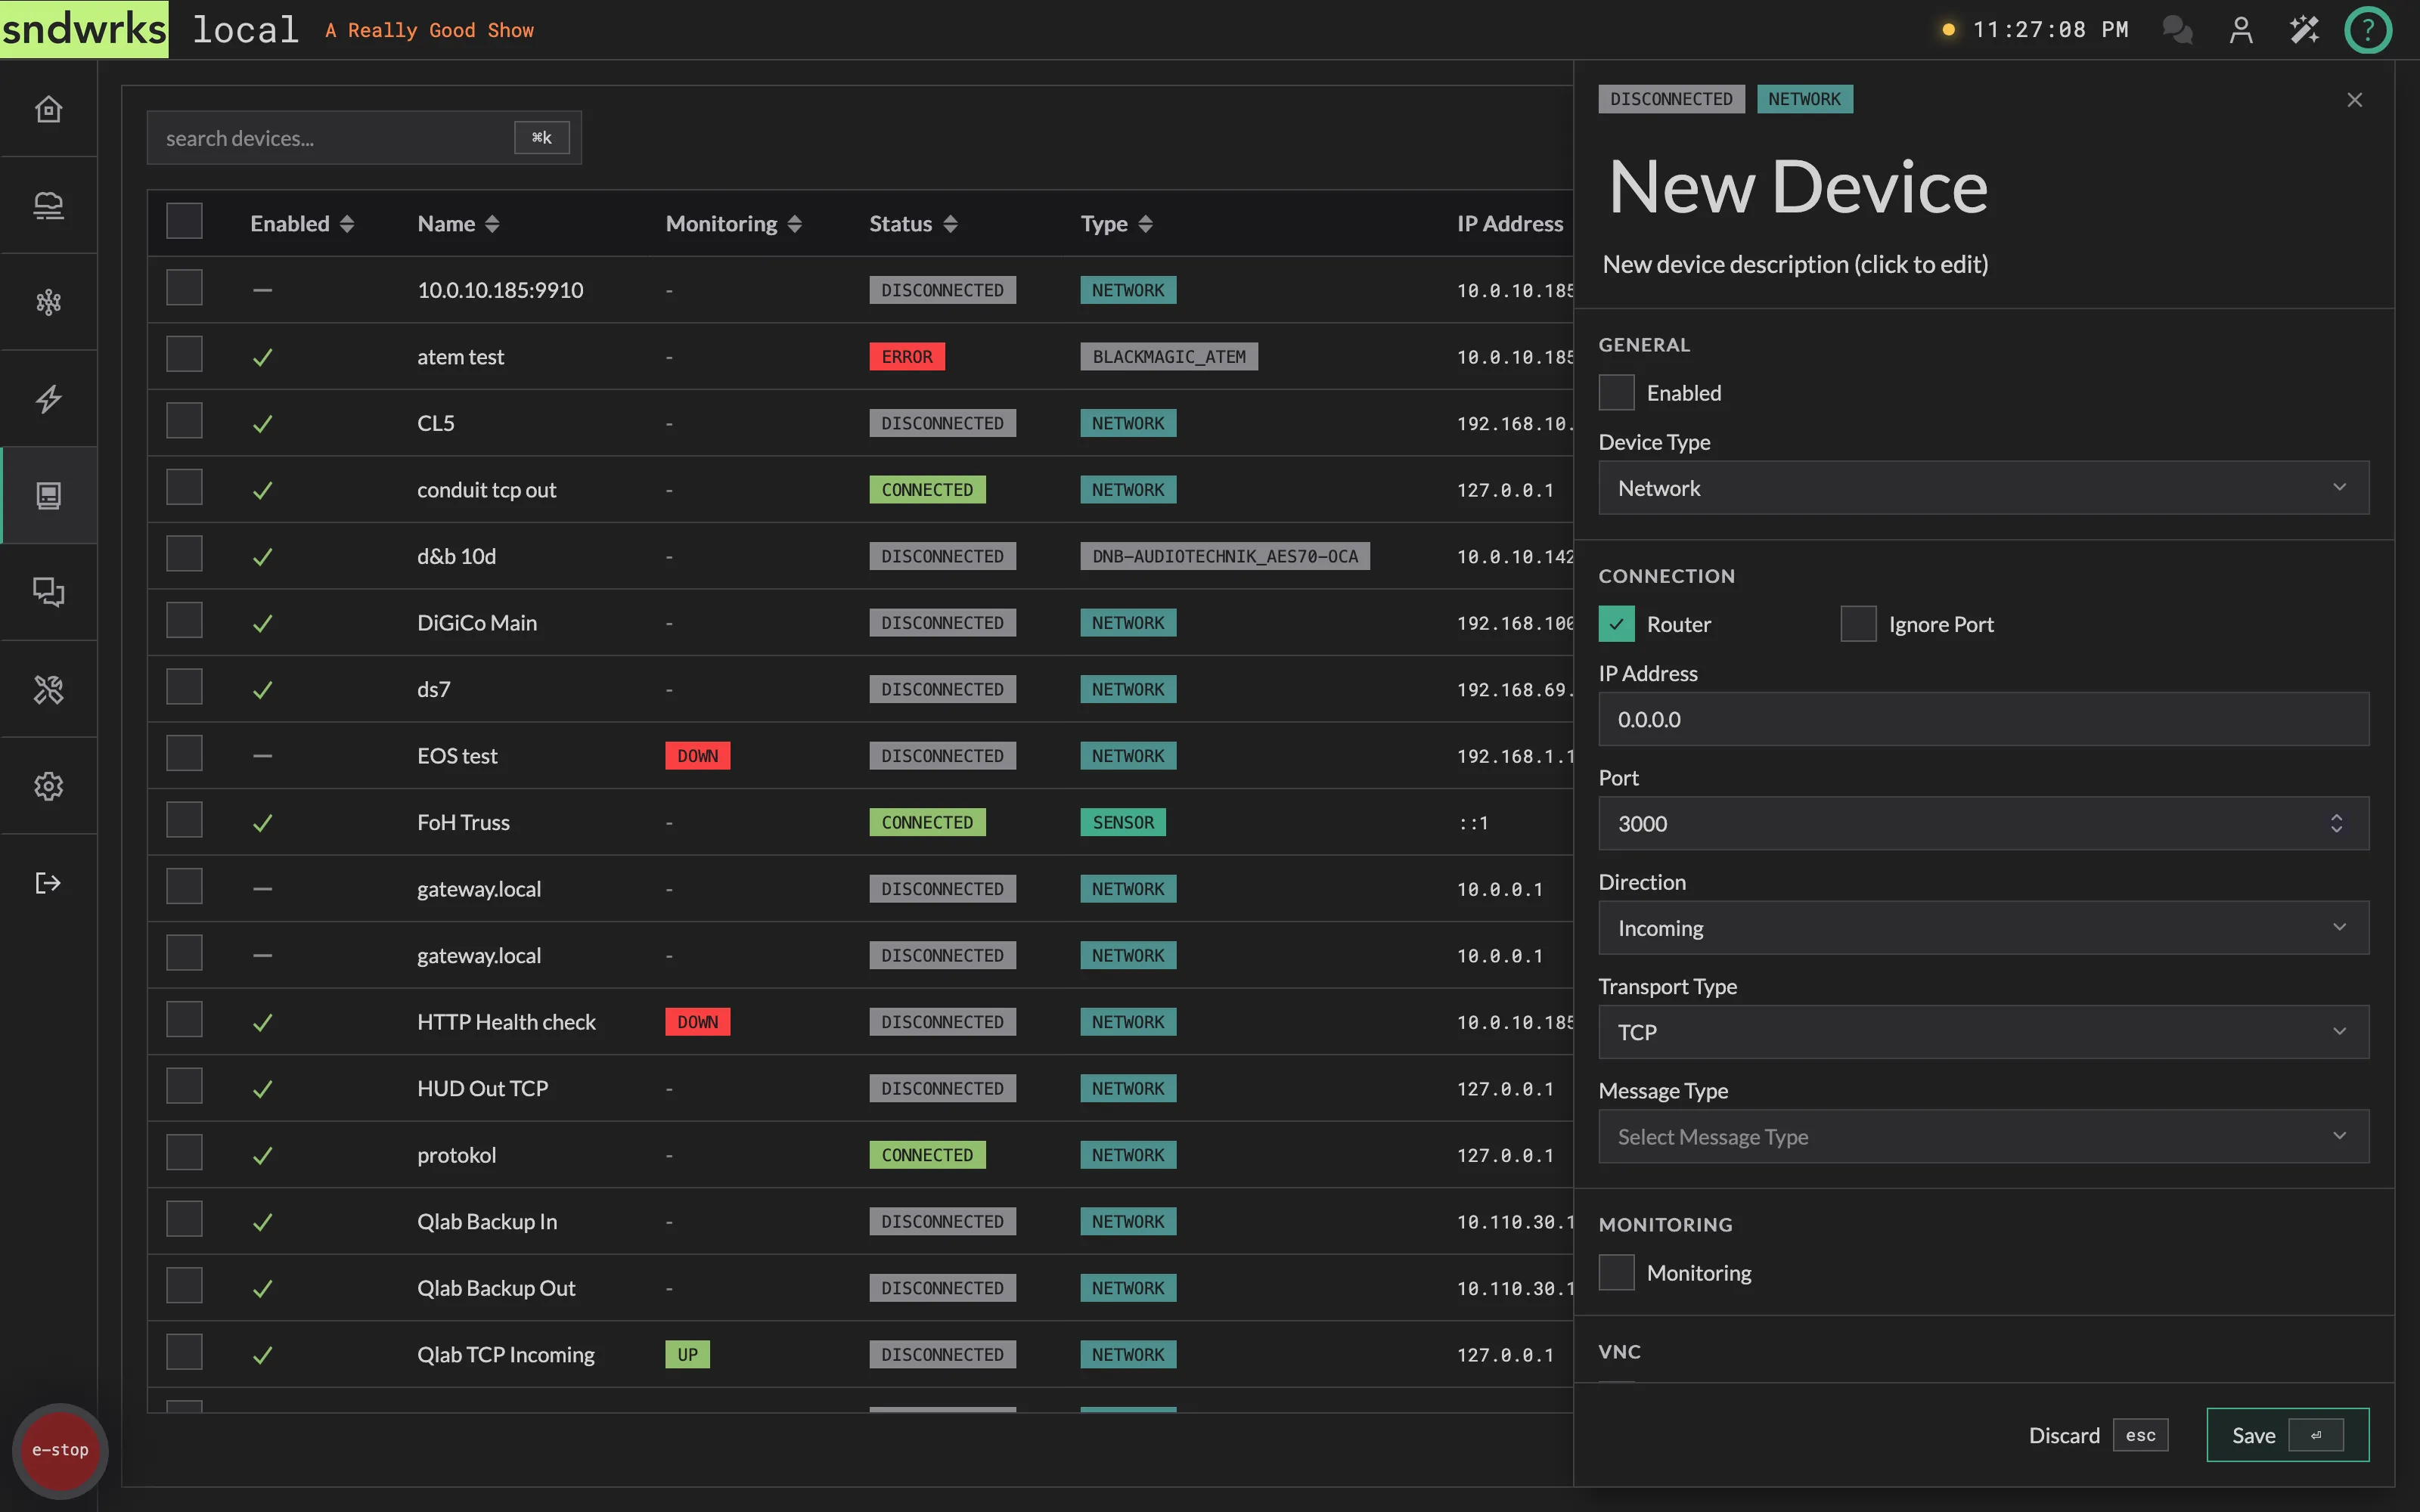
Router
Section titled “Router”This exposes the device in the router matrix allowing for message routing for this device. The direction exposes it as an input (incoming), output (outgoing) or both (bi-directional).
Selecting Router exposes some more options for a device.
Direction
Section titled “Direction”This option is exposed after Router is selected. It selects how this device should behave.
For example, a console sending udp on a specific port would be incoming, but that same console would be another device as outgoing to send to the console. A TCP device could be bidirectional if you want to use the same connection to send and receive data.
Transport Type
Section titled “Transport Type”Transport Type selects which network transport to use: UDP or TCP.
Message Type
Section titled “Message Type”This selects the message type you’d expect the device to send or receive. The server will do it’s best to dynamically identify the type, but this allows for eager parsing.
We like eager parsing because it allows us to lower the latency, which we think is important in live environments.
Monitoring
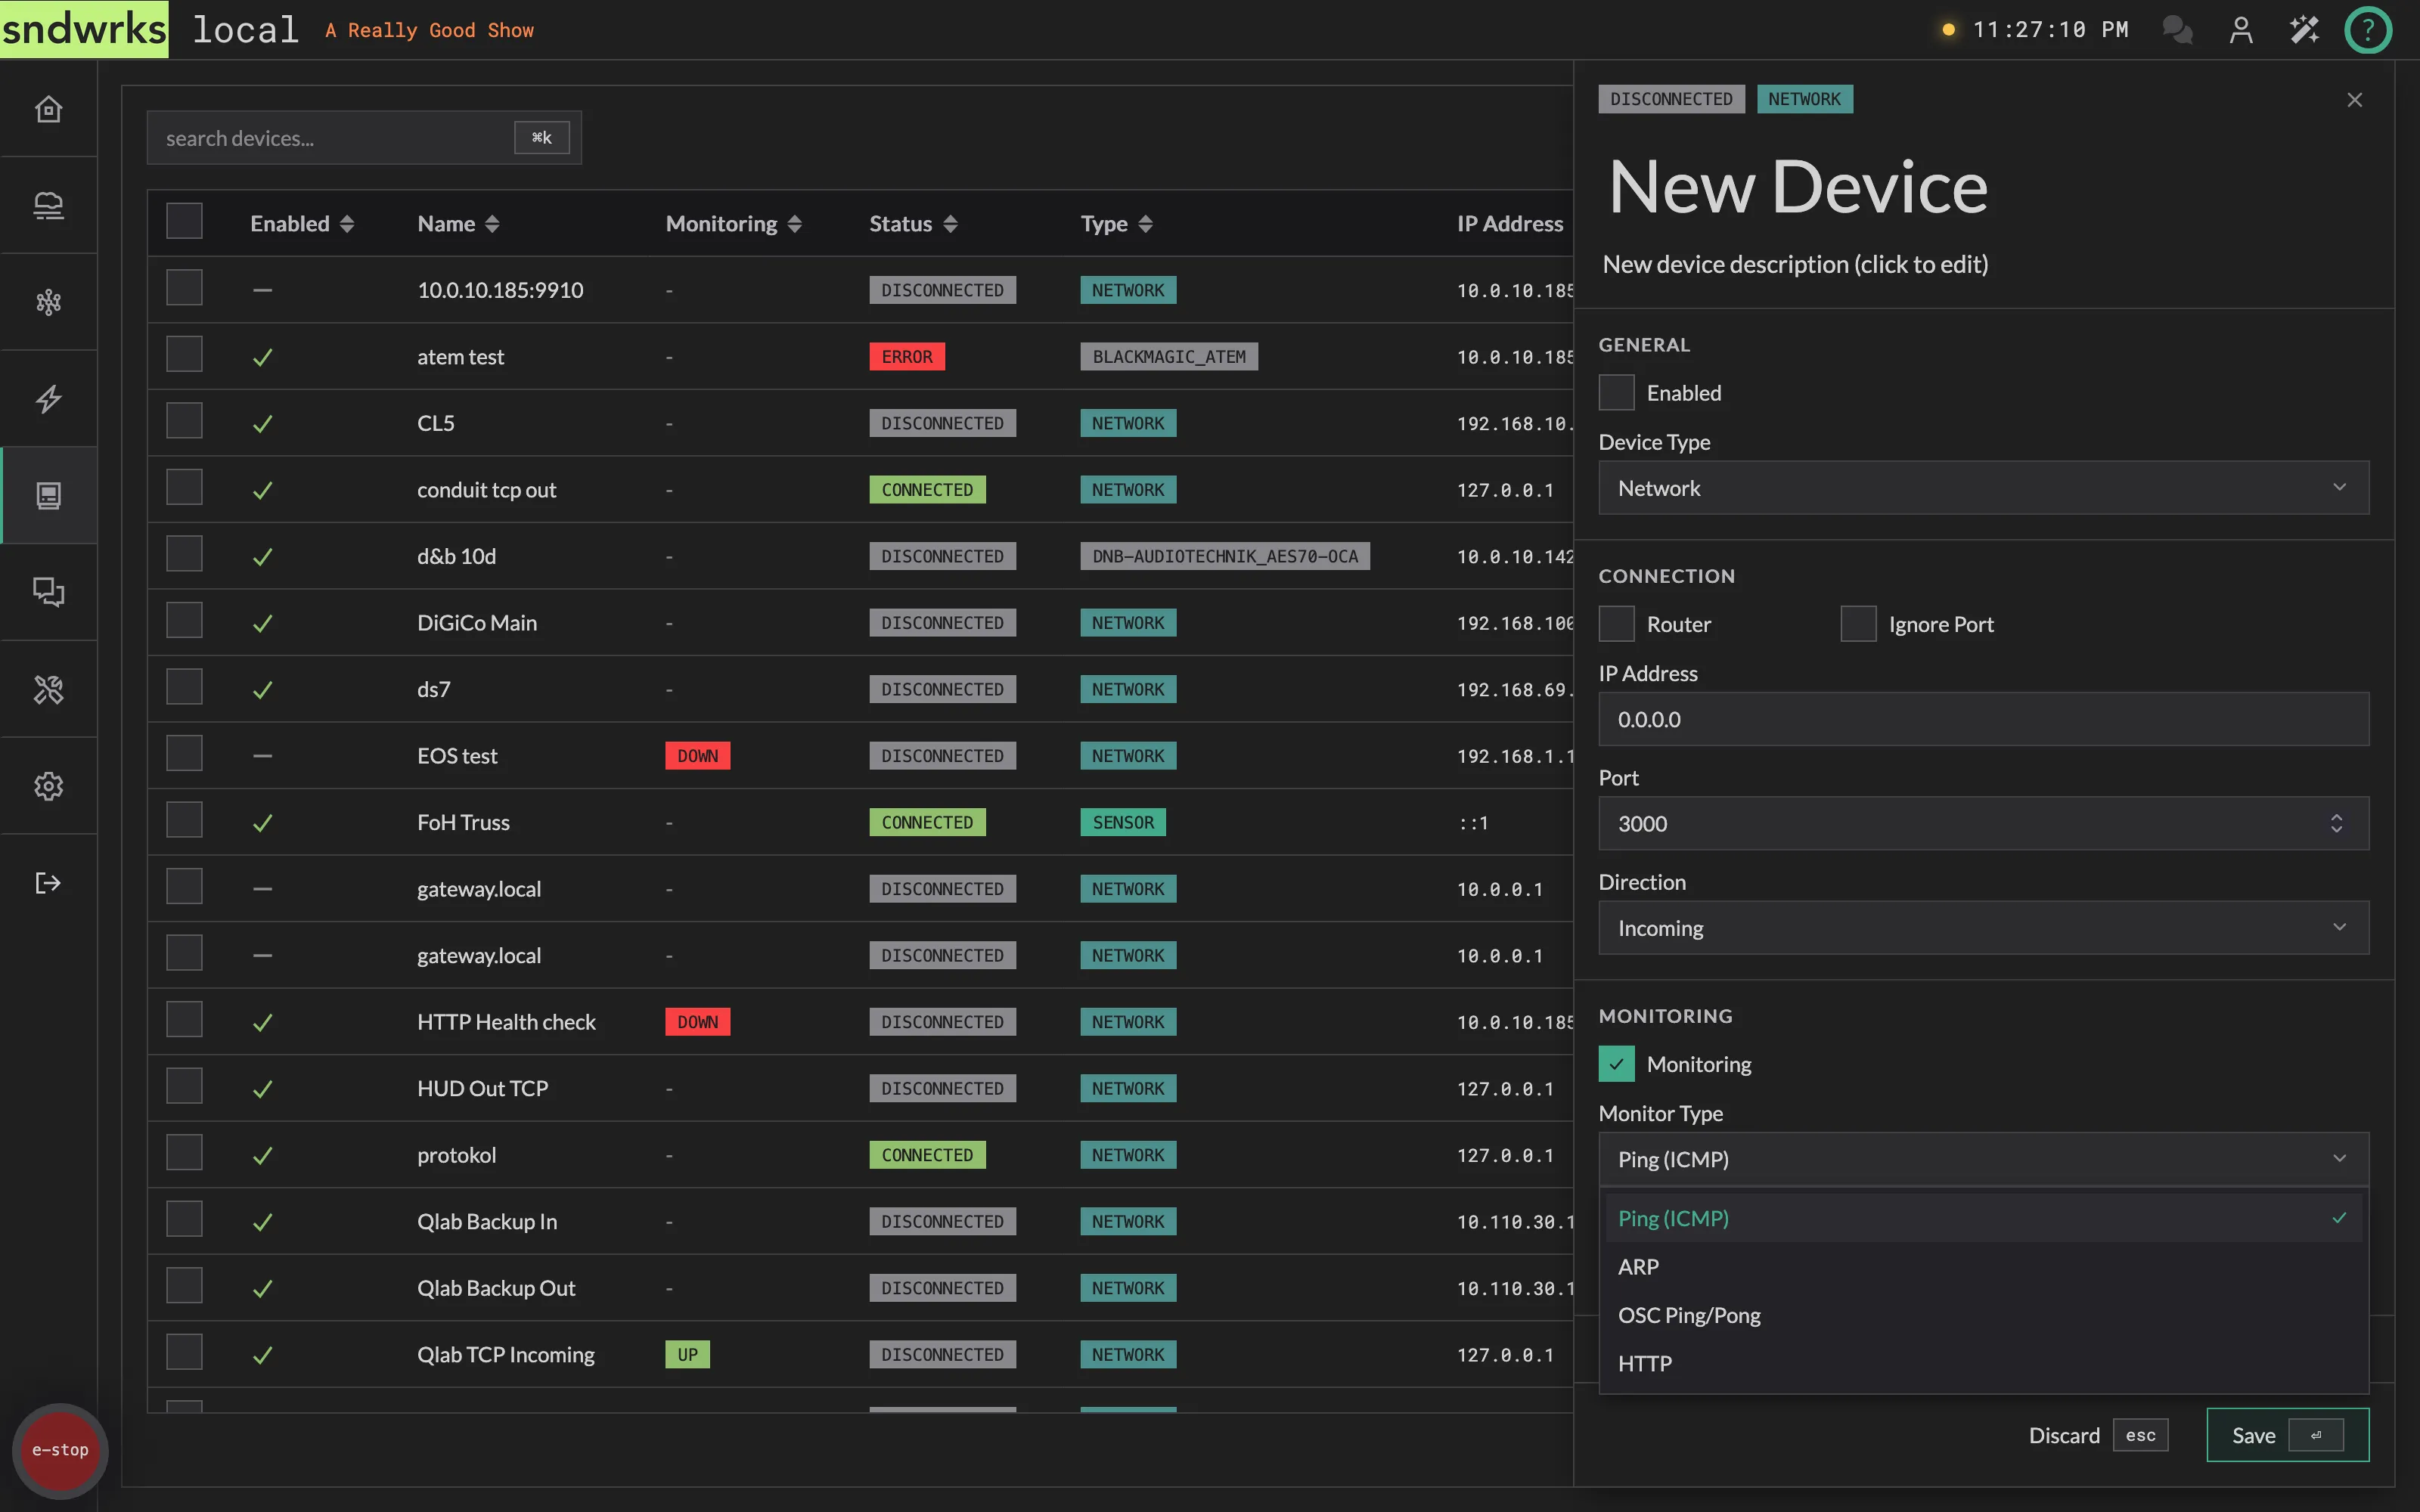
Section titled “Monitoring”There are four device monitoring options right now: ARP, Ping, HTTP, and OSC.
ARP
The ARP monitoring sends out arp requests to the target and then we check to see if it responded. This mode is useful if a network device doesn’t respond to a ping.
The ARP monitoring will show if the OS is up on the host machine.
Ping
The ping monitoring will send out an ICMP ping to the target. It will show as up when the ping is successful.
Ping monitoring will show if the OS is up. Some network devices will not respond to ping messages.
HTTP
The http monitoring will send a request to the entered address, and then check the response to see if it is correct.
HTTP monitoring is useful when you want to check if an application is up not just the host machine.
OSC
The OSC monitoring is a ping/pong check. So, the server sends the first message then waits to see if there’s a response that matches the configured address.
OSC monitoring is helpful when you want to check if a specific application is not only up but is also receiving and sending OSC messages.
If the device is a machine with a screen, you can turn on VNC here and open a remote desktop for it without leaving the app. The section holds the port, the stored credentials, and the button that opens a session.
Full details on Device VNC.
Deleting a device
Section titled “Deleting a device”You may not want a device to stay forever. Well, we have a unique solution to that: the Delete Button! Wow!
Open the device and click the delete icon; a confirmation appears at the bottom of the editor. Then confirm that and it’s gone! As a note, we do NOT have undo so this is a permanent action. Give us a call if you need something restored.
Connection state
Section titled “Connection state”Each device row shows its live state in the Status column: disconnected, connecting, or connected.
This will only stay connected if the server can maintain a persistent connection to the device in question. UDP for example is inherently stateless, so it will never say connected or may momentarily say it’s connected.