
Overview
The “Hello, and welcome!” page. It’s a tabbed dashboard: analytics, device monitoring, and macro buttons.
Analytics
Section titled “Analytics”Analytics is the first tab, so it’s what you land on.
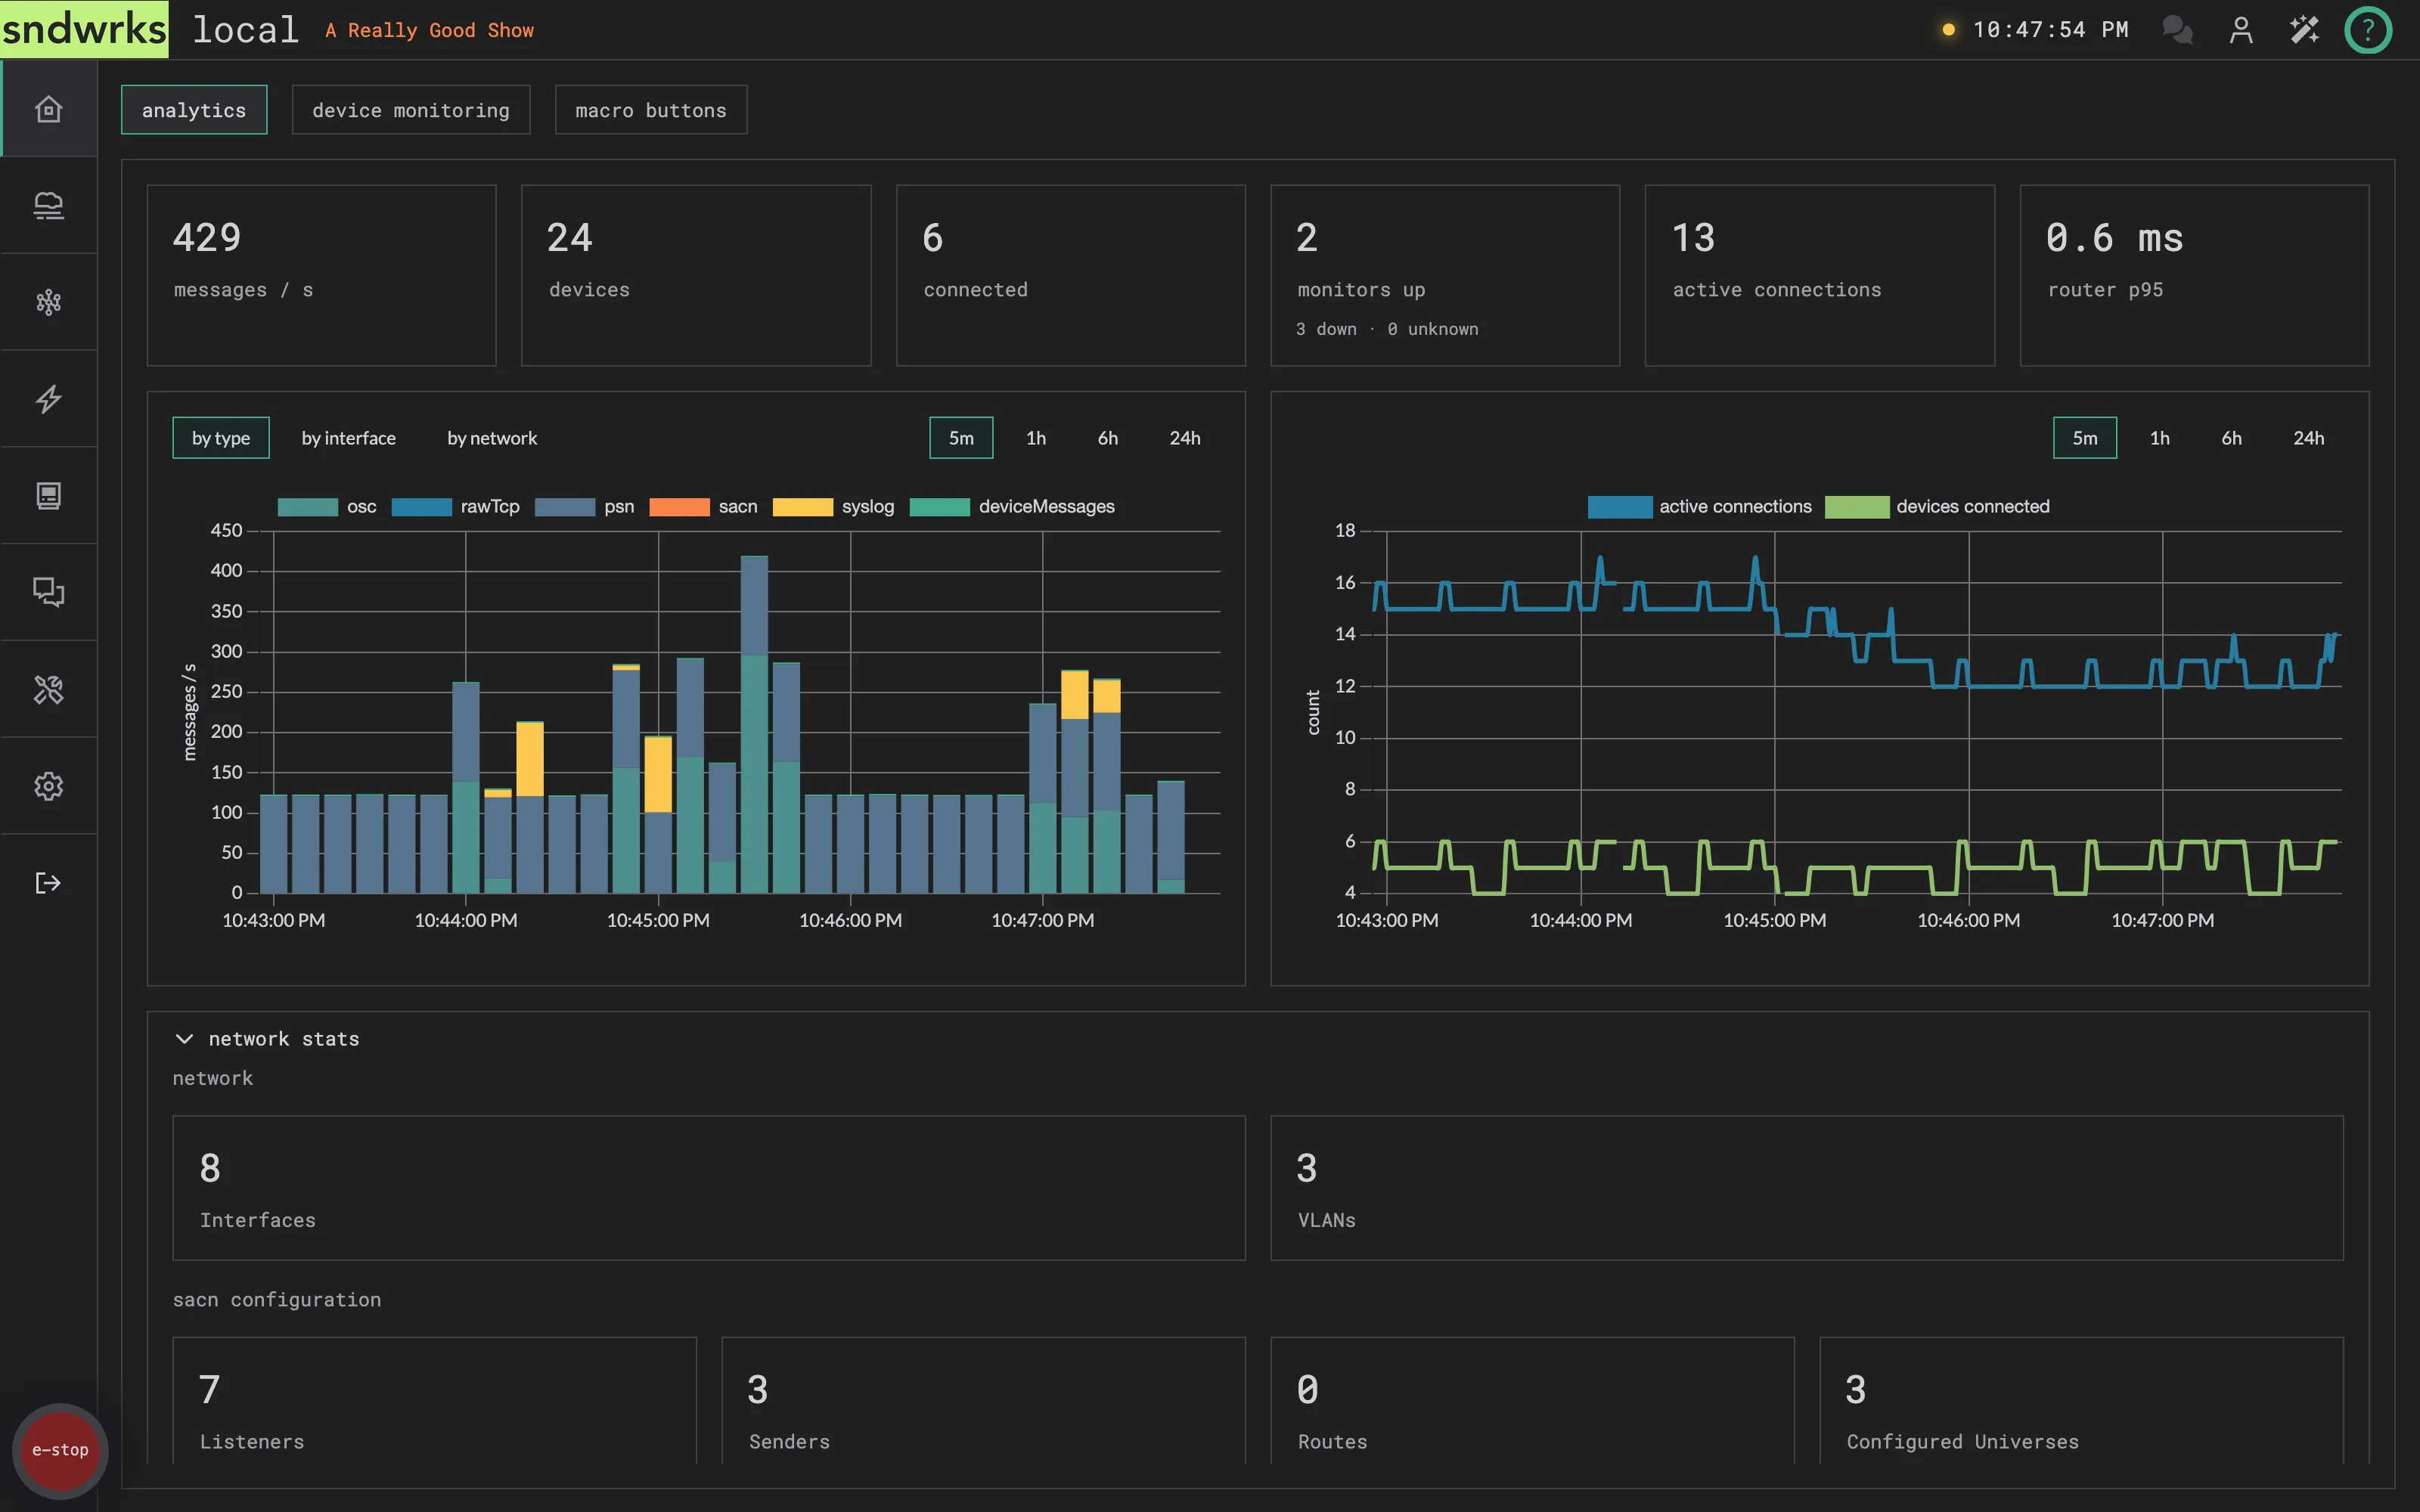
The tiles across the top are live counters: messages per second, device and connection counts, and the router’s p95 in/out latency.

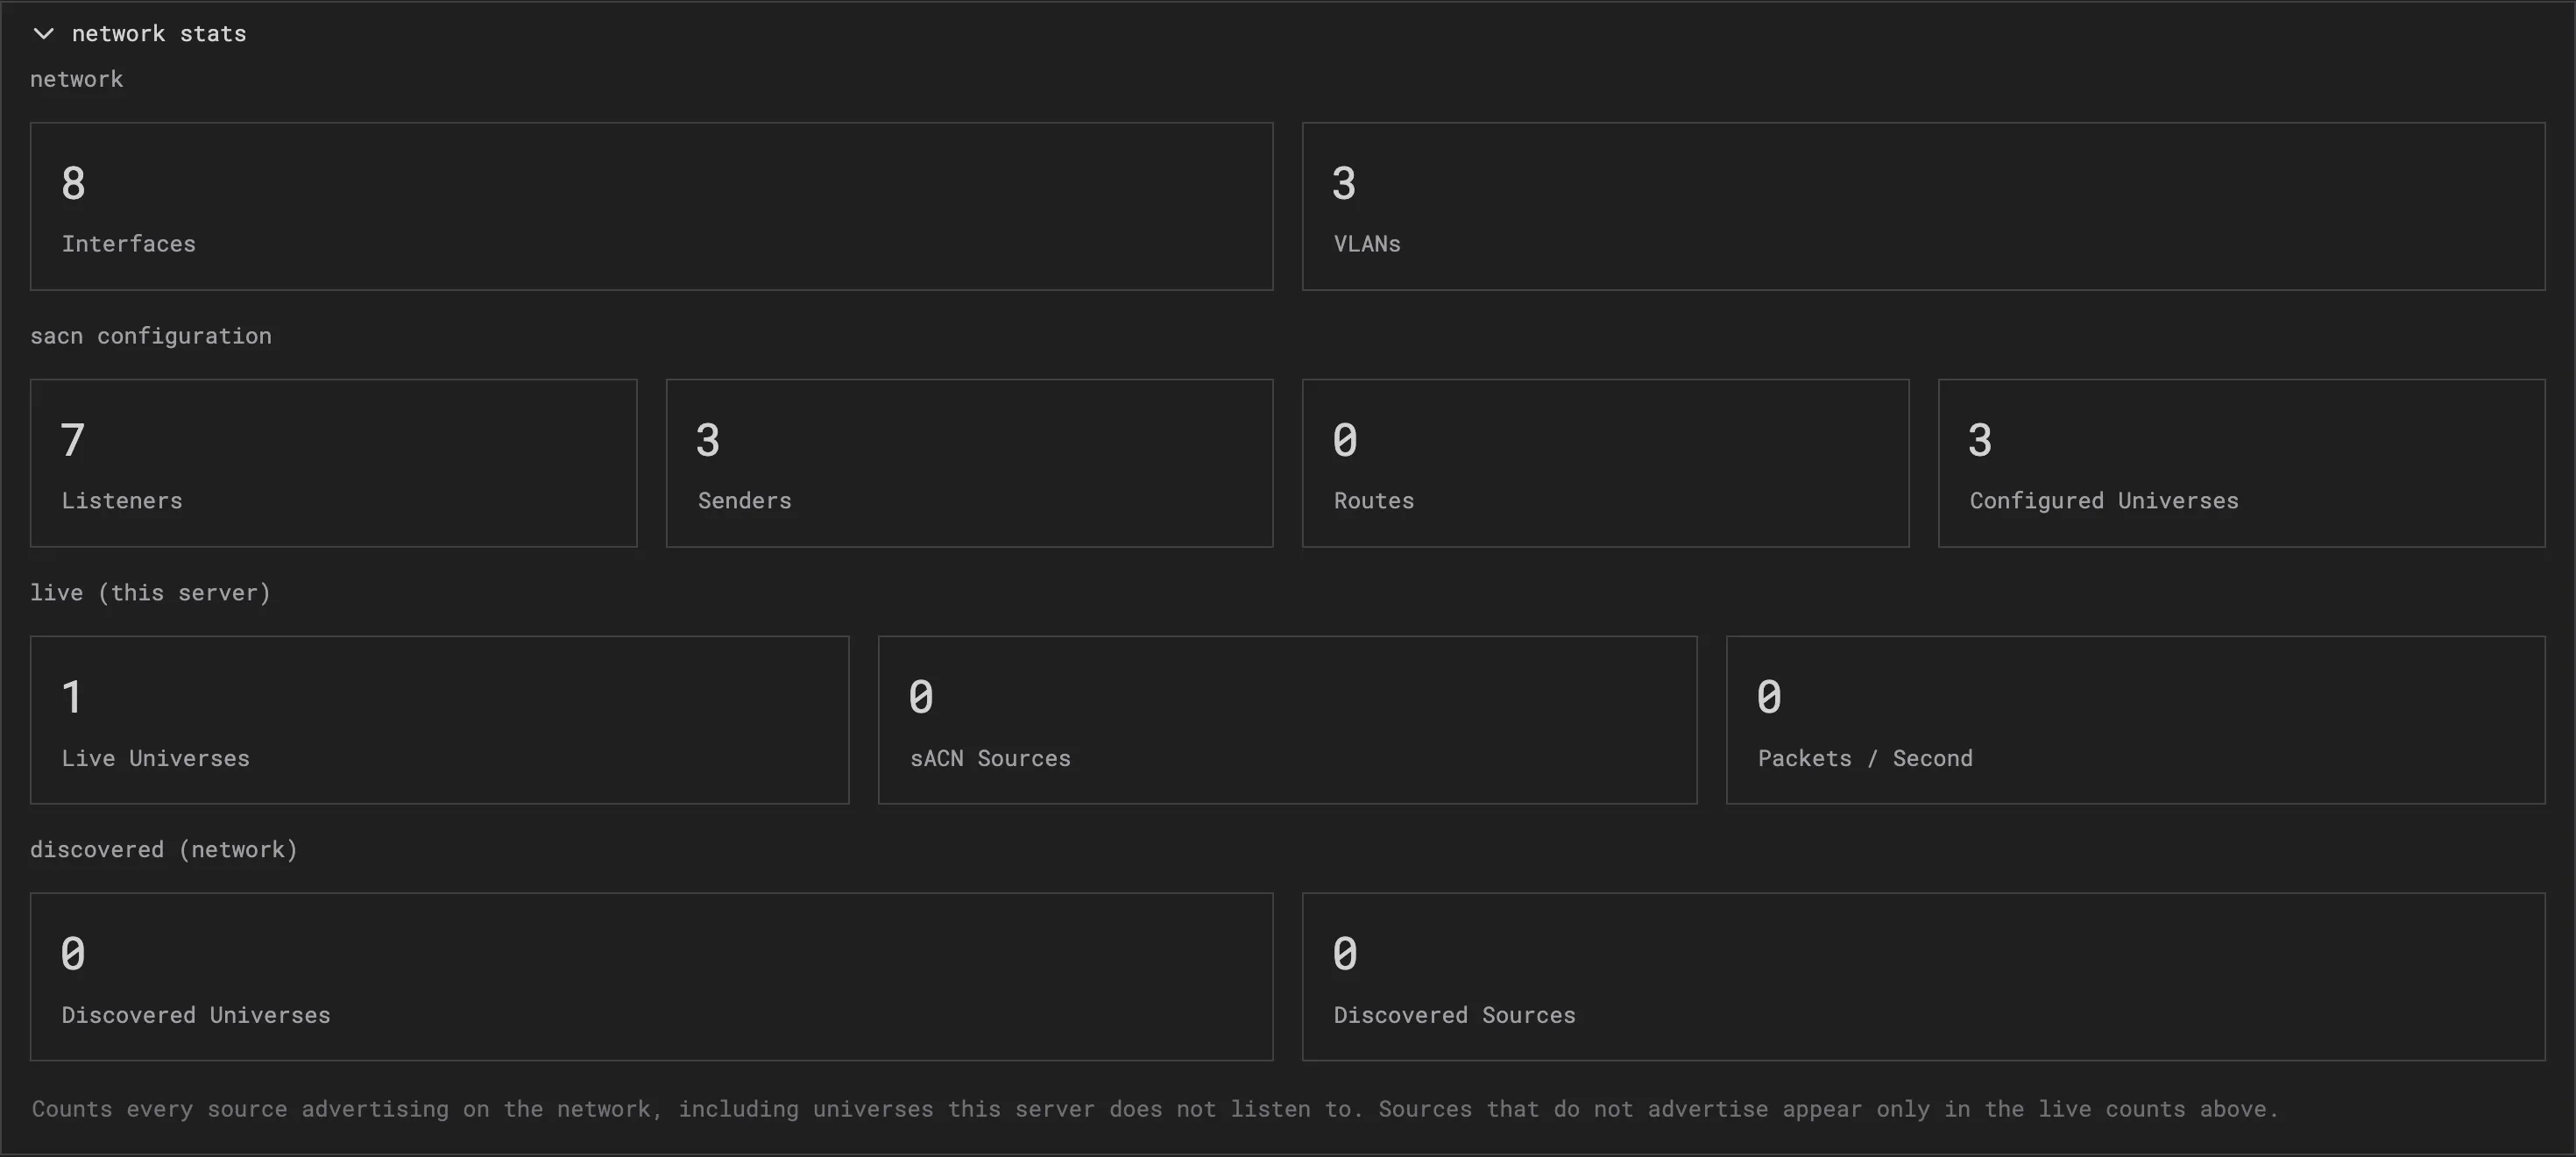
Network stats sit below them, broken out per interface.
Device monitoring
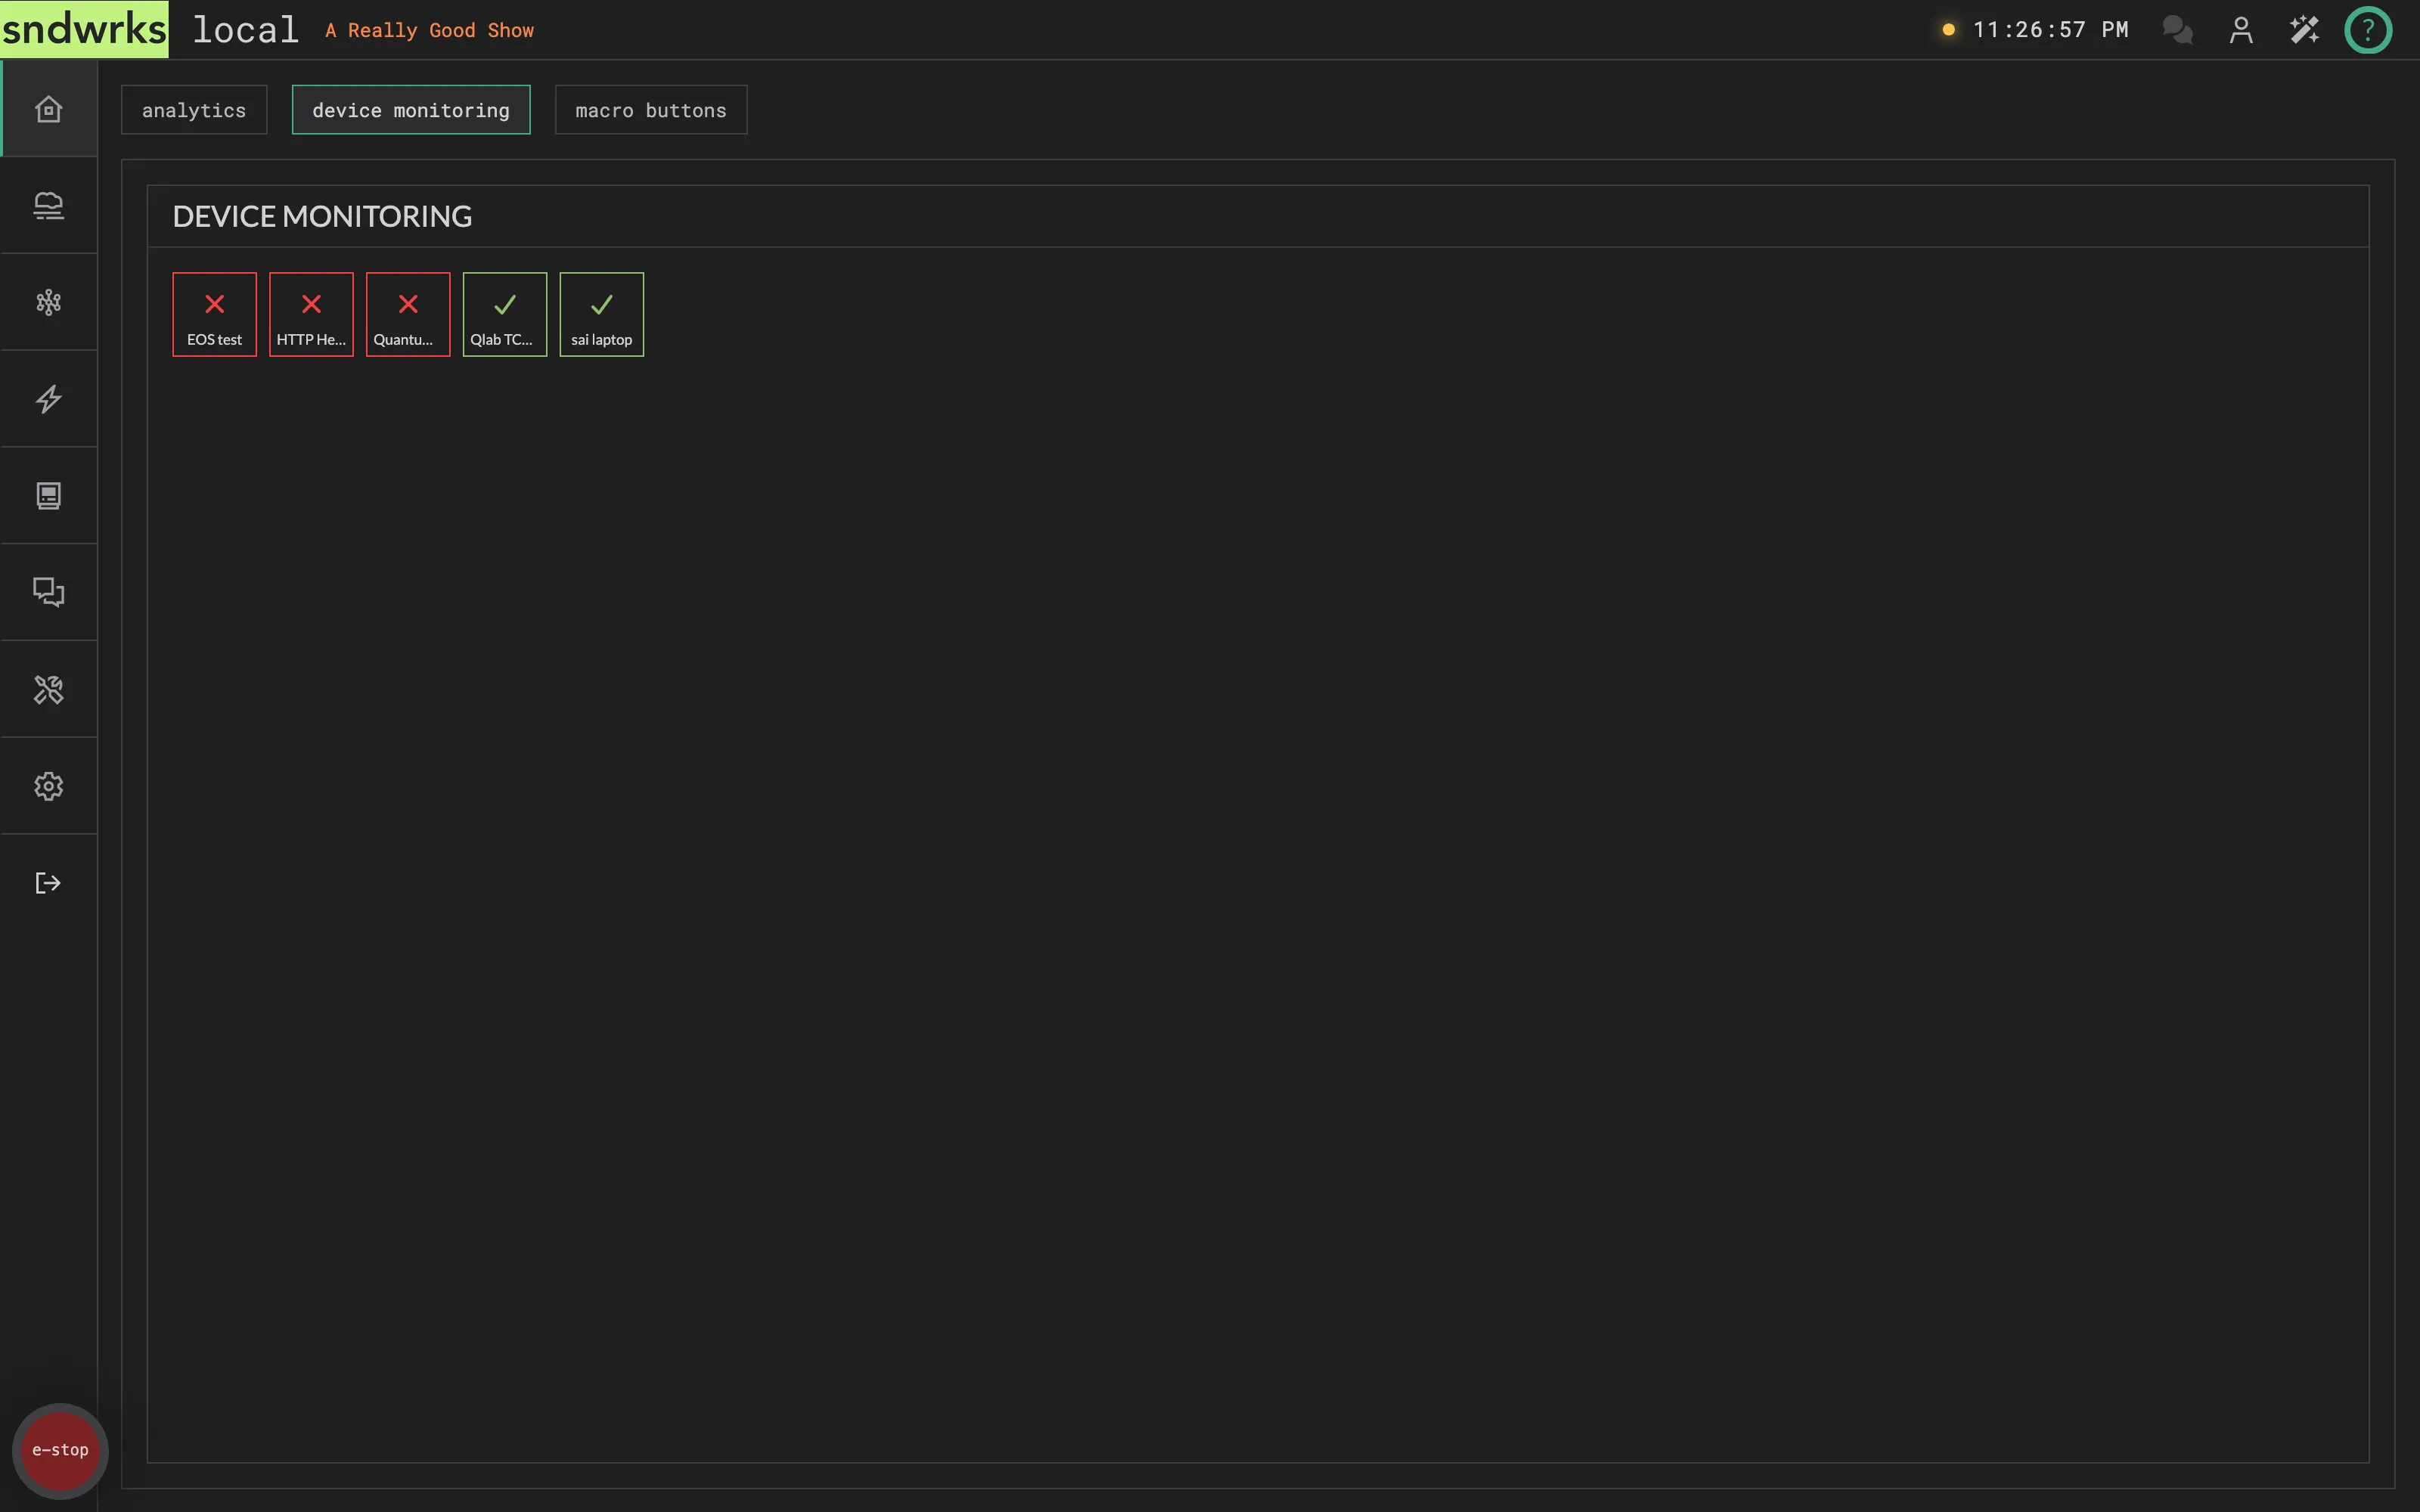
Section titled “Device monitoring”Devices that have monitoring selected will show up here with their state.
Don’t see a device you were expecting? Don’t despair. Confirm that monitoring is turned on. Here’s the docs for that.
Pin macros to the overview
Section titled “Pin macros to the overview”The macro buttons tab holds a row of one-tap buttons. Tap a button, the macro fires.
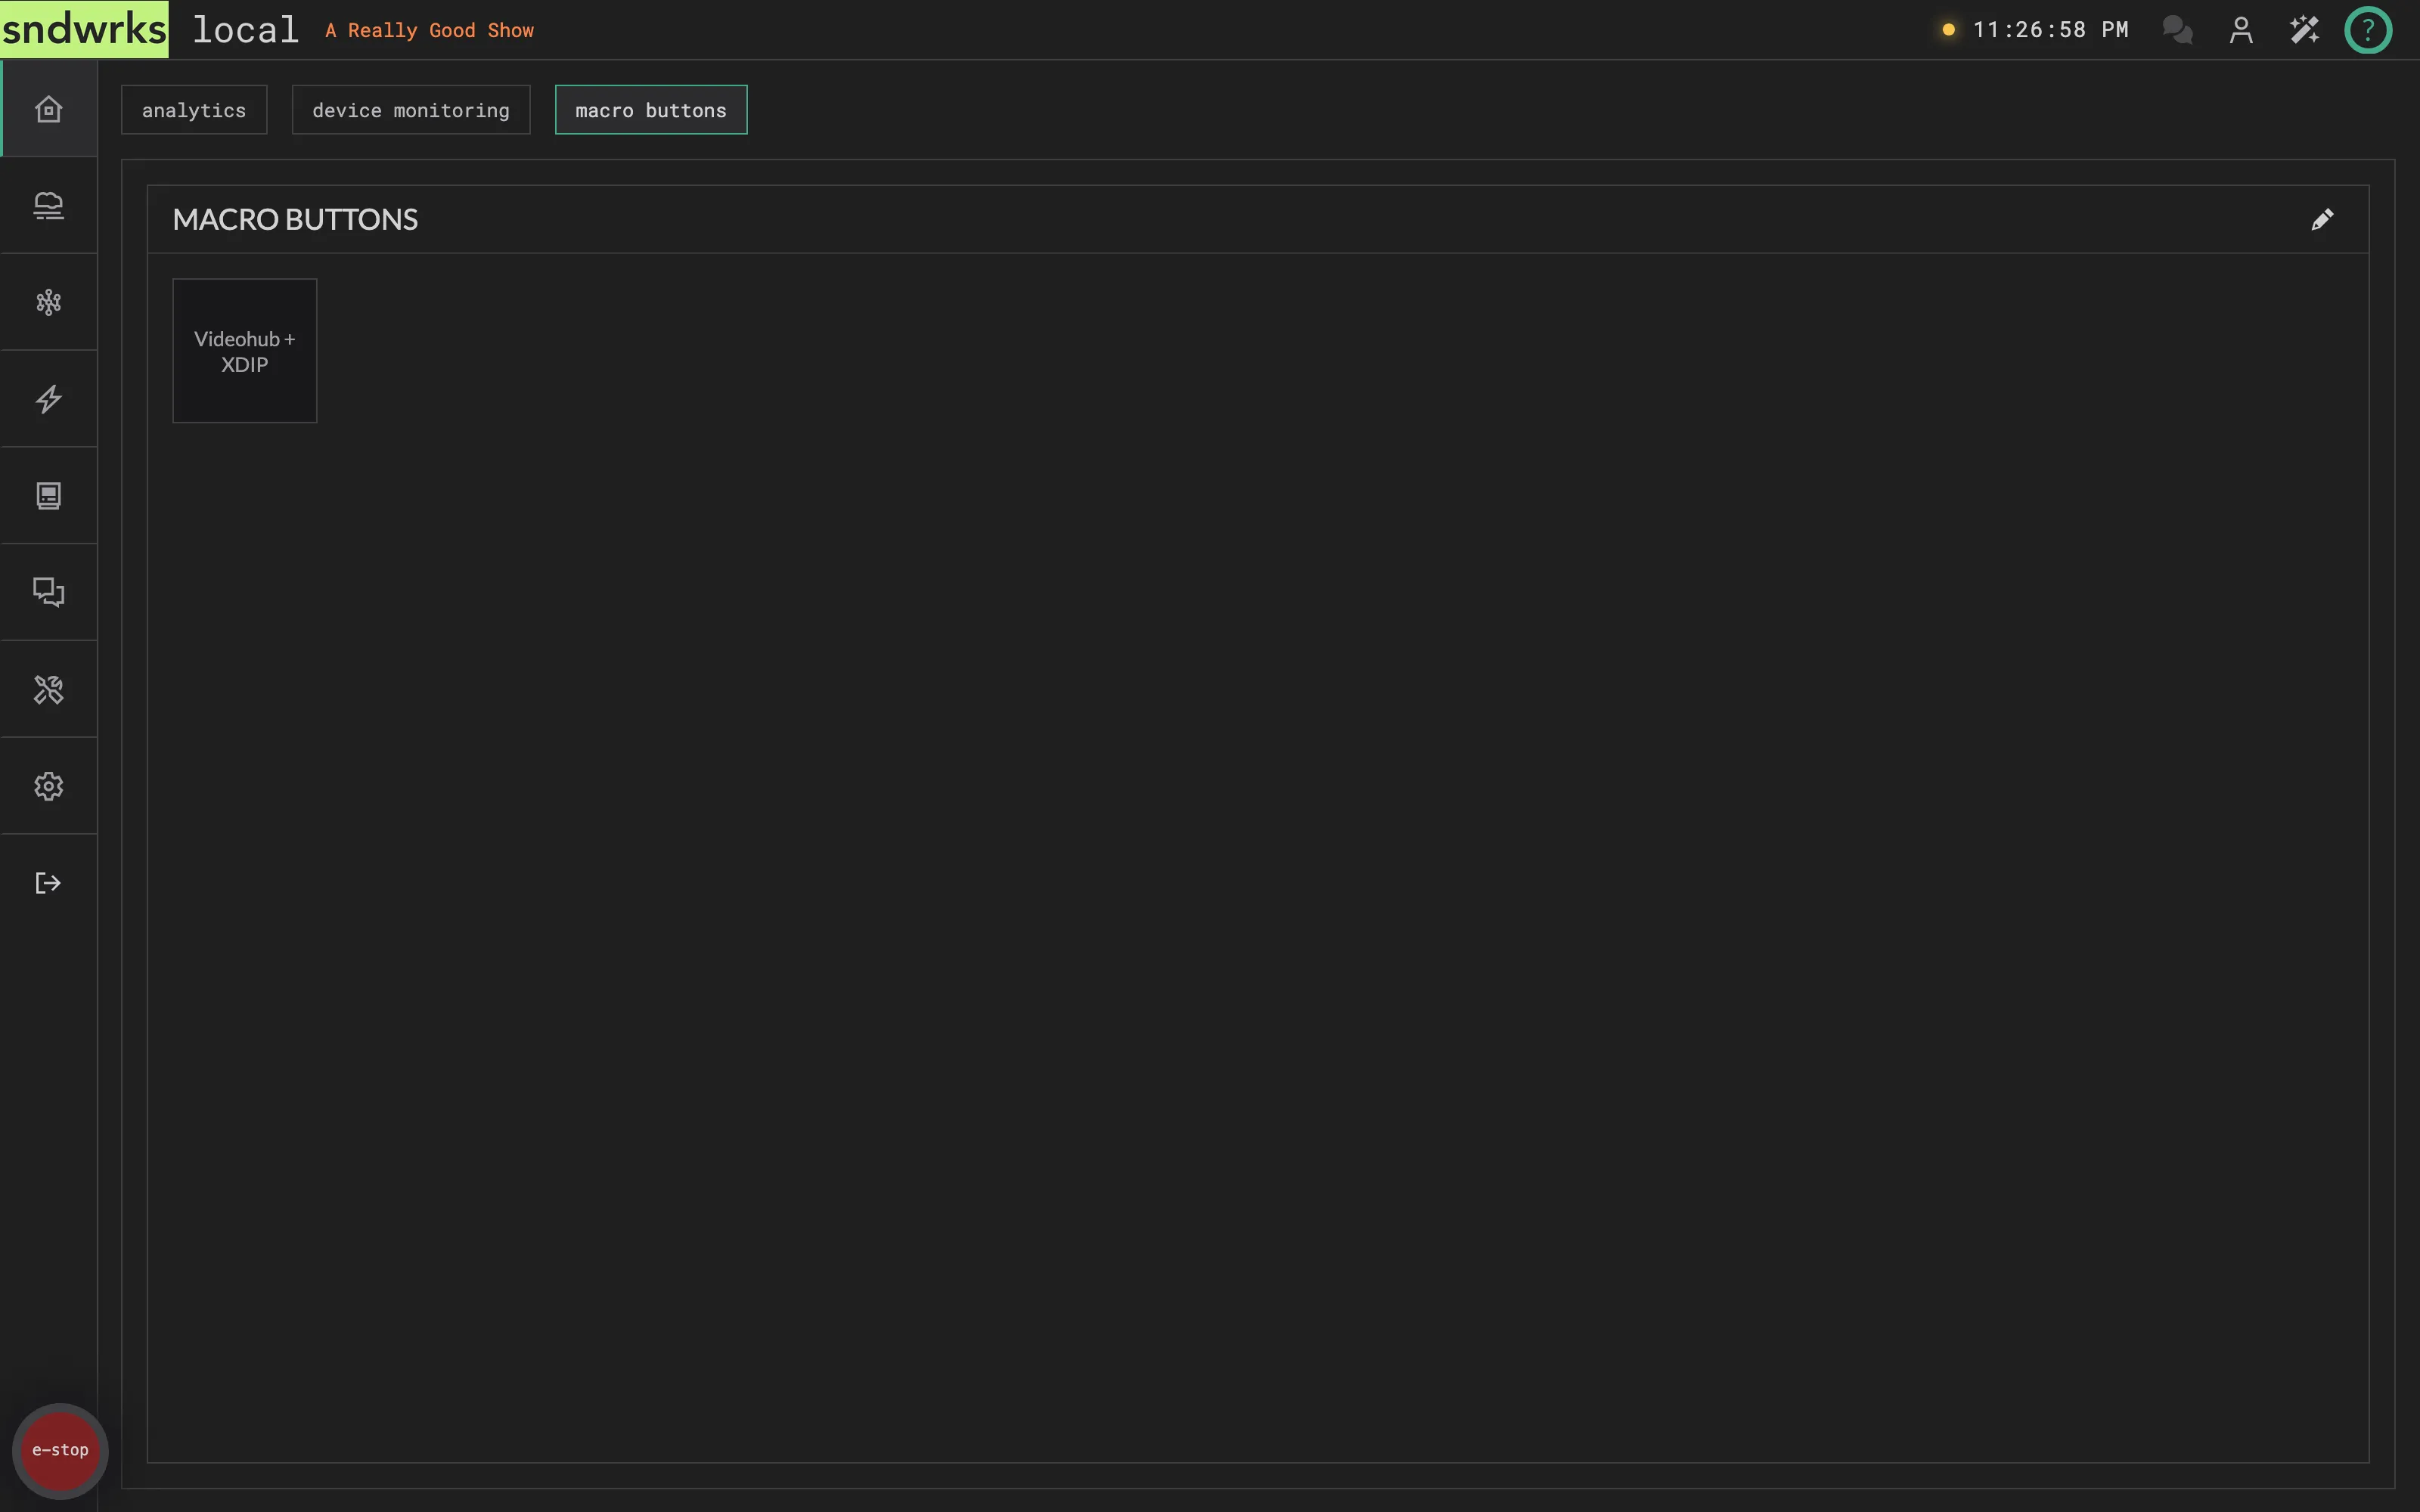
The pencil icon next to the button row opens the Edit Macro Buttons modal.
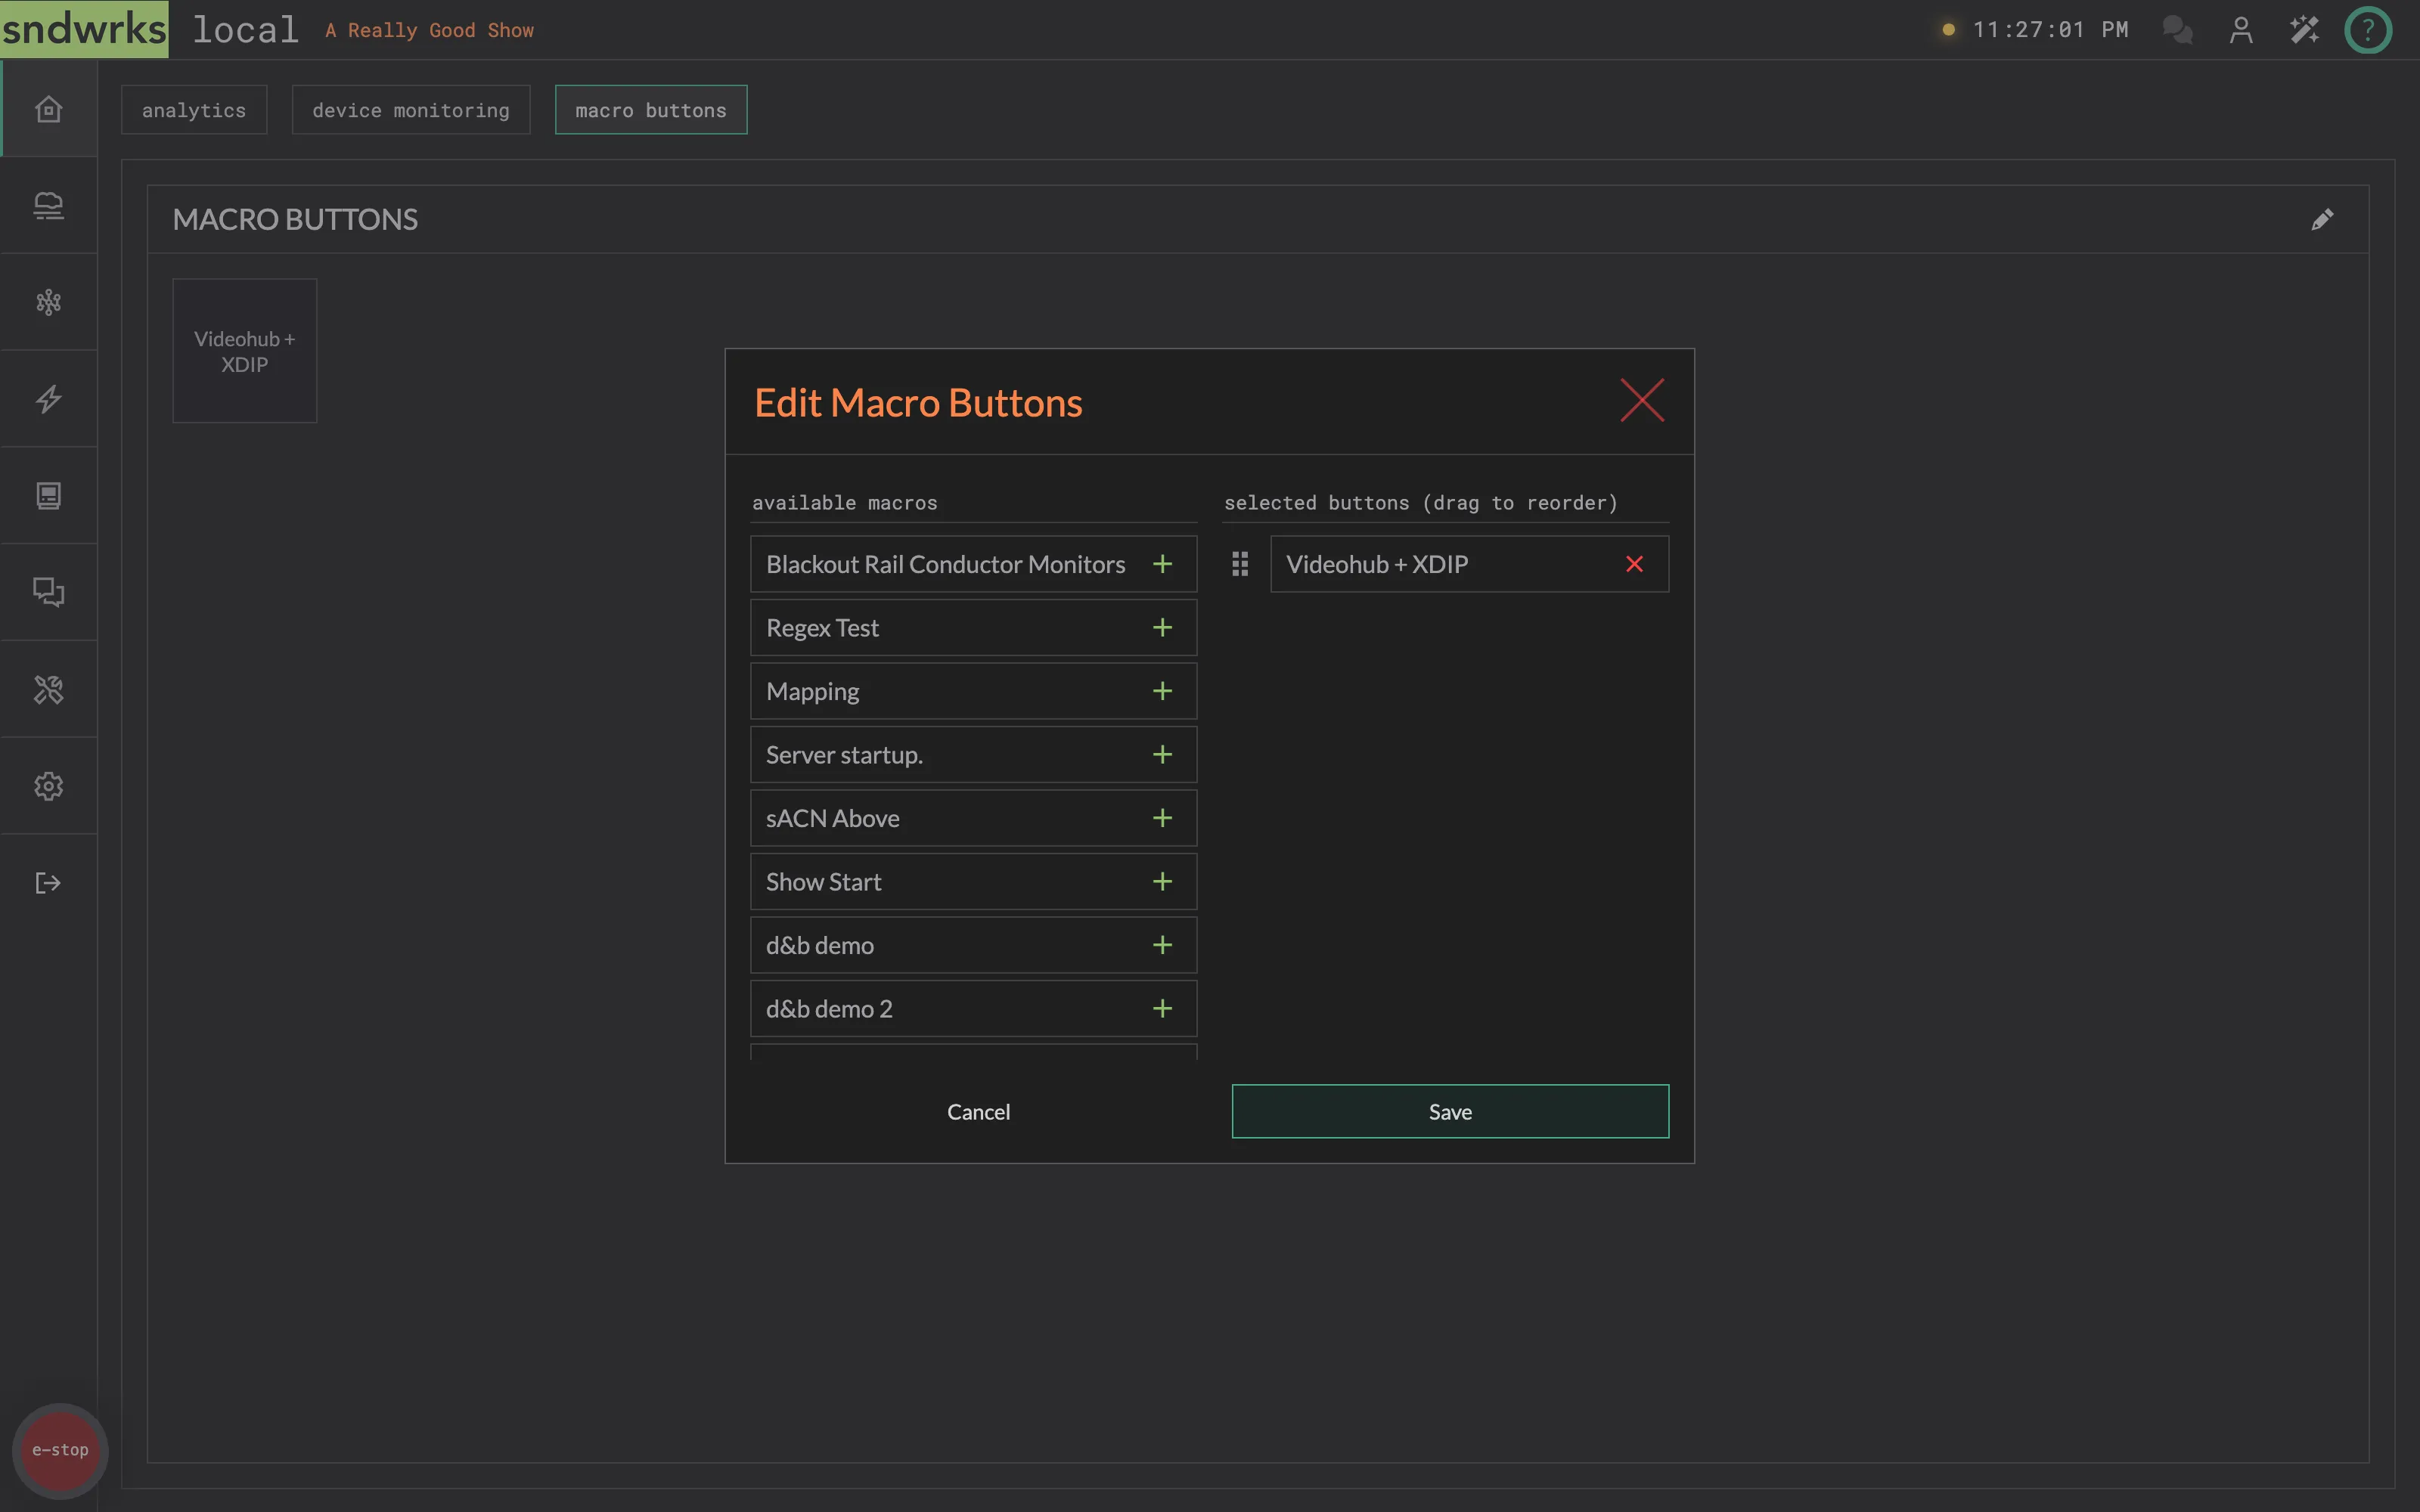
- Click the pencil icon.
- In available macros, click
+next to each macro you want pinned. - In selected buttons, drag rows to reorder, or click
Xto remove. - Click Save.
Build the macros themselves on the Macros page.